Mapping Tool Functions Page Top
The Mapping Tool has twelve functions to display the environment monitoring data on the map.
Making a Map showing Air Dose Rate Distribution
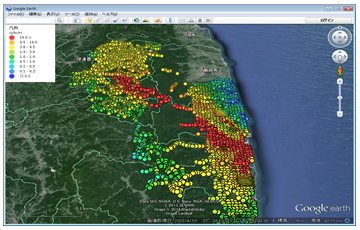
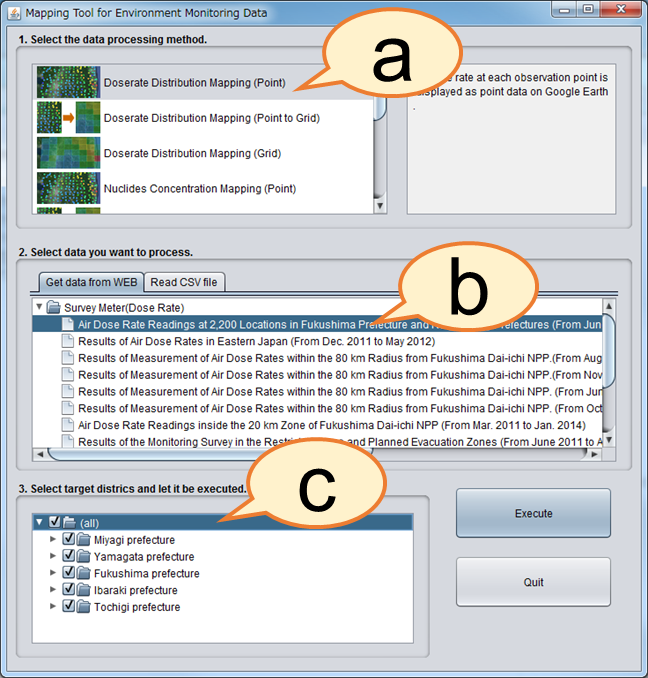
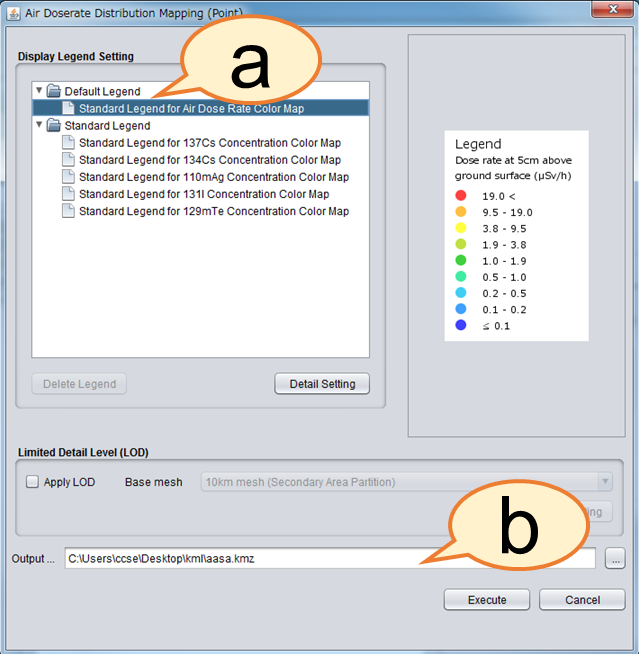
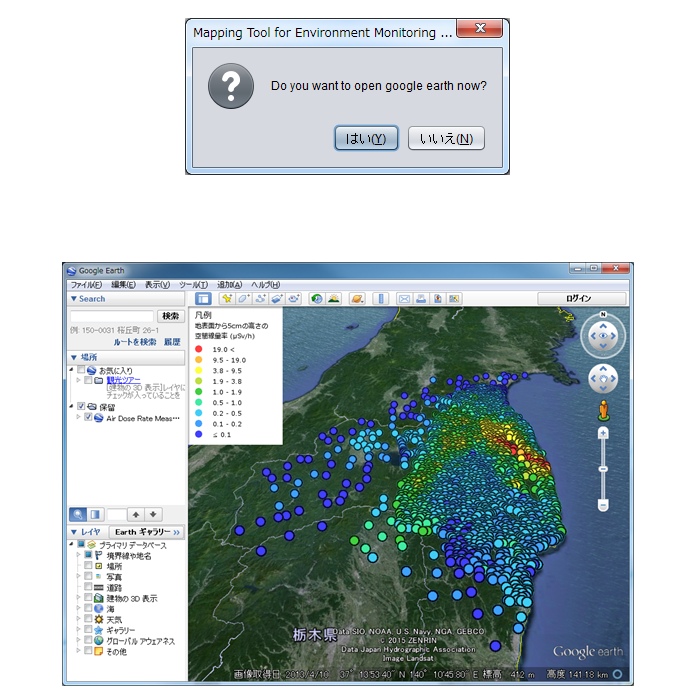
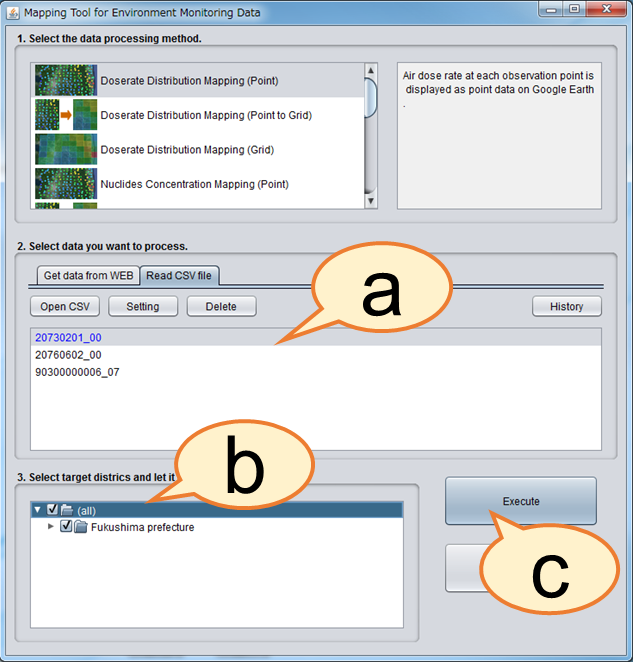
Dose Rate Distribution Mapping (Point)
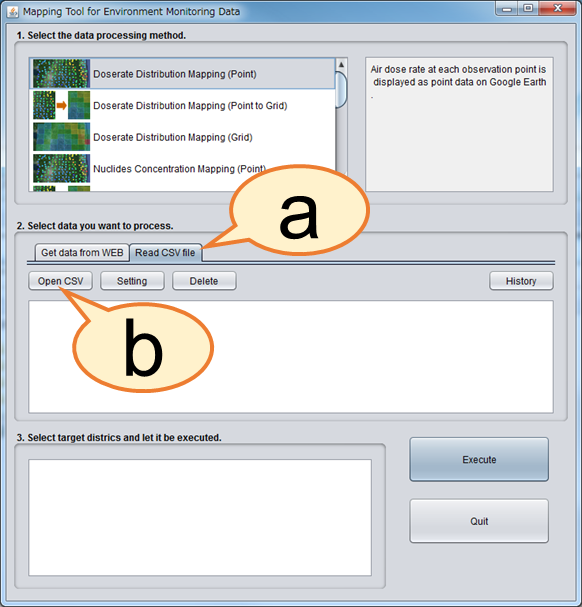
This function is to display air dose rate measurements in point form.
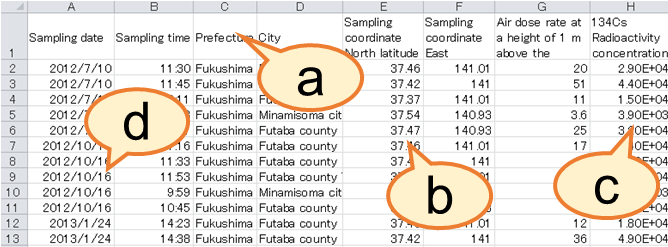
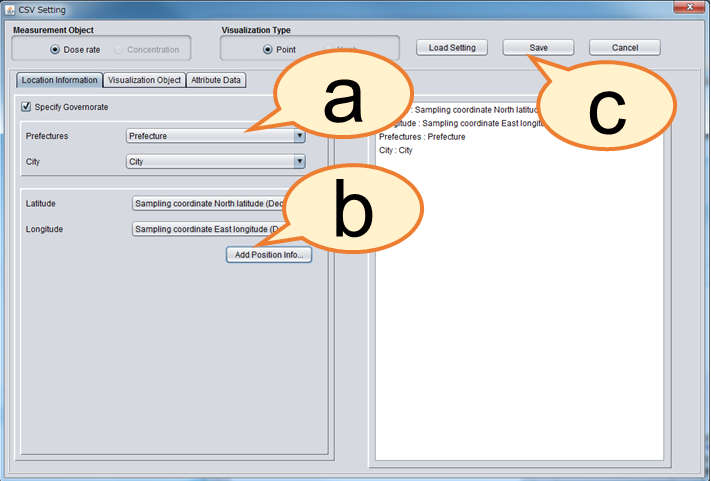
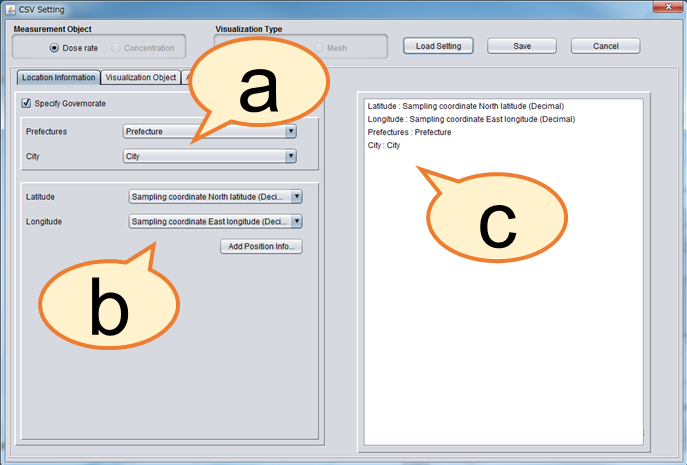
To create this type of map, longitude, latitude, and air dose rate for each of the measurement points are required.
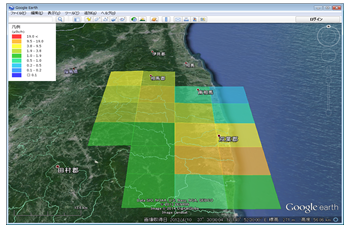
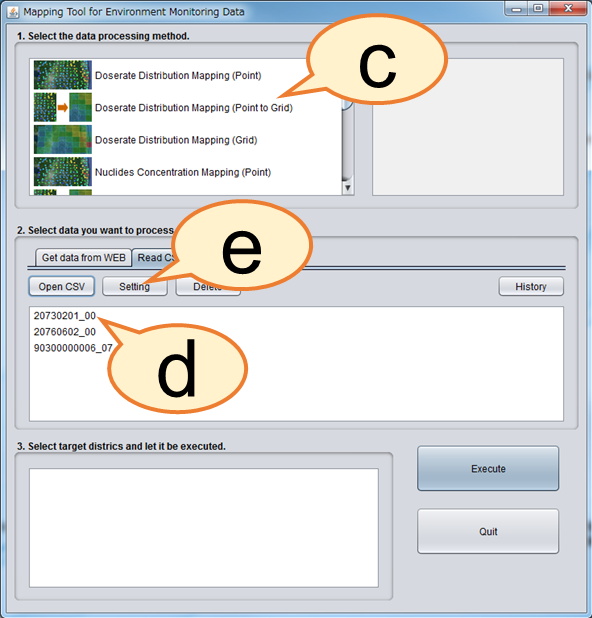
Dose Rate Distribution Mapping (Point to Grid)
This function displays the air dose rate in grid form.
The value of each grid cell is represented by the average of the measured air dose rates within the designated cell.
Longitude, latitude, and air dose rate for each of the measurement points are required to create this type of map.
Data Japan Hydrographic Association
Data SIO, NOAA, U.S. Navy, NGA, GEBCO
Image Landsat
©2015 ZENRIN
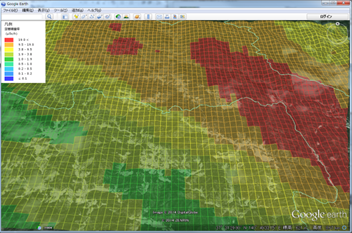
Dose Rate Distribution Mapping (Grid)
This function displays air dose rate information from airborne monitoring covering wide areas. Data are displayed in grid form.
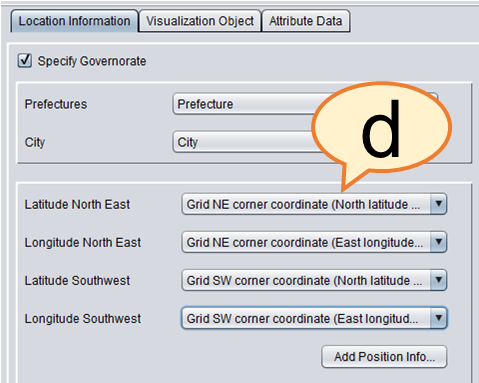
Latitude and longitude for each of the four corners of the grid cells that come with measured data are used to define grid in KML therefore users cannot change grid resolution*.
To create this map, air dose rate, latitude and longitude for all four corners of the grid cell are required.
*LOD function allows to create maps with arbitrary rid resolutions.
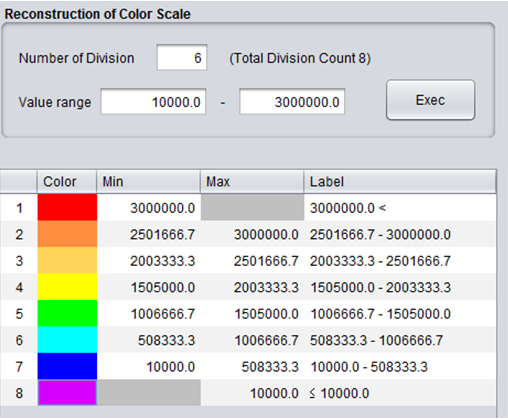
Making a Map of Radionuclide Concentration
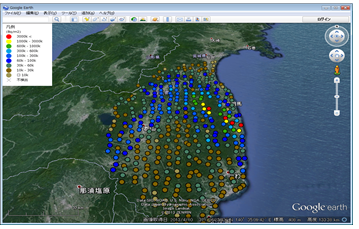
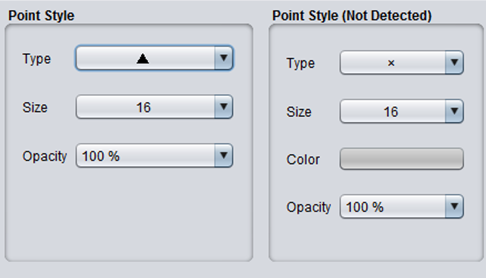
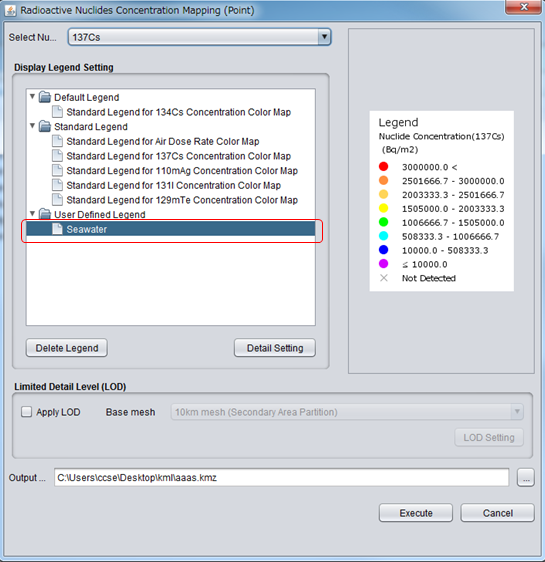
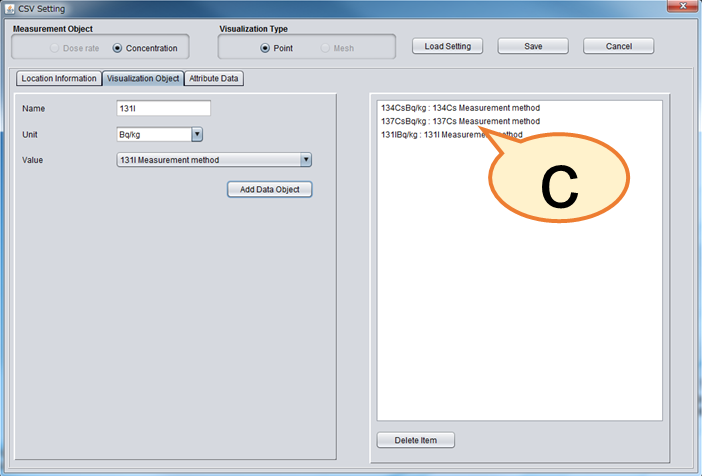
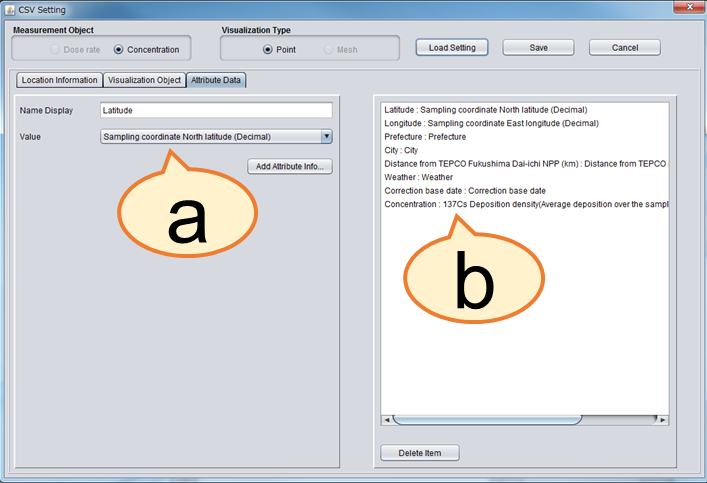
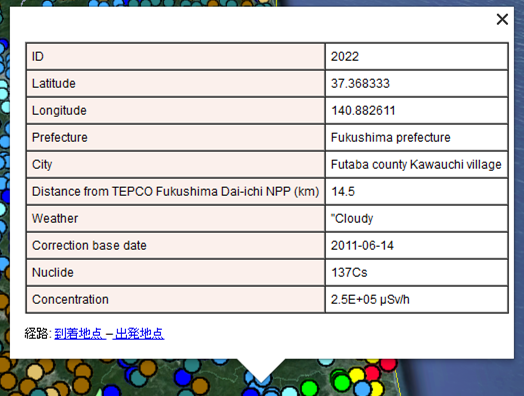
Nuclides Concentration Mapping (Point)
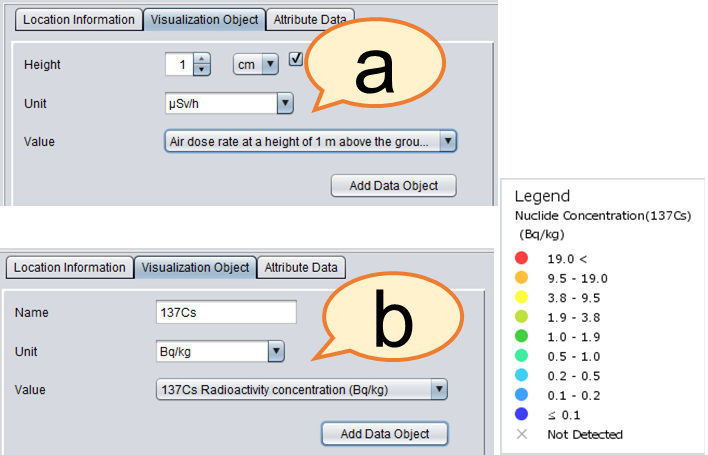
This function displays radionuclide concentration in point form.
To create this type of map, latitude, longitude, and radionuclide concentration of soil at the measurement points are required.
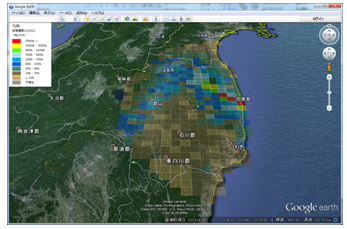
Nuclides Concentration Mapping (Point to Grid)
This function displays nuclide concentration in grid form.
The average of the measured nuclide concentrations within the designated grid cell represents the value of the cell.
To create a map, longitude, latitude, and nuclide concentration of the measurement points are required.
Data Japan Hydrographic Association
Data SIO, NOAA, U.S. Navy, NGA, GEBCO
Image Landsat
©2015 ZENRIN
Nuclides Concentration Distribution Mapping (Grid)
This function displays air dose rate information from airborne monitoring covering wide areas. Data are displayed in grid form.
Latitude and longitude for each of the four corners of the grid cells that come with measured data are used to define grid in KML therefore users cannot change grid resolution*.
To create this type of map, the radionuclide concentration, latitude and longitude of the four corners of each grid cell, and are required.
*LOD function allows to create maps with arbitrary rid resolutions.
Advanced Functions
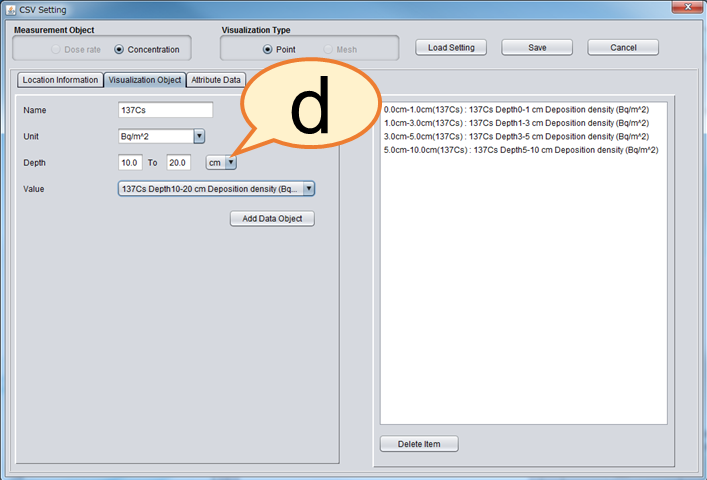
Depth Distribution Graph
This function displays a graph depicting the relationship between depth (from ground surface or sea surface) and radioactivity concentration.
The graph appears when clicking a measurement point.
This function requires latitude, longitude, and radioactivity concentration of soil at each measurement depth.
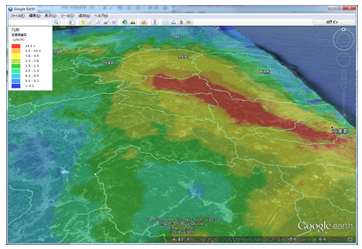
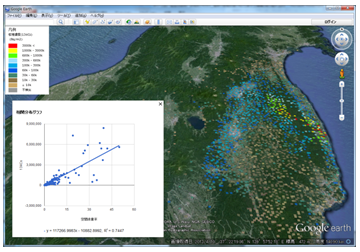
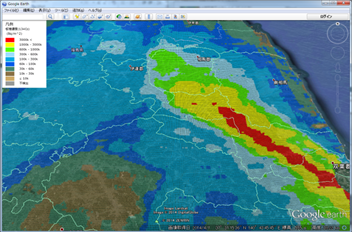
Visualization by Interpolation
This function conducts interpolation from measured air dose rate or nuclide concentration to create data that convers the whole designated area with interpolated data as well as measured data.
This type of image displays a smooth gradient image over a wide range, therefore it is convenient way to provide an overview of radioactivity distribution tendency.
Users can select either of the interpolation methods Inverse Distance Weighted (IDW) or Kriging*.
To make a map, longitude, latitude, and measured data of the measurement points are required.
* To use Kriging, installation of R (an open source statistical computing software) and geoR package are required.
http://www.r-project.org/index.html
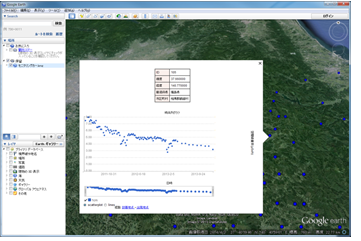
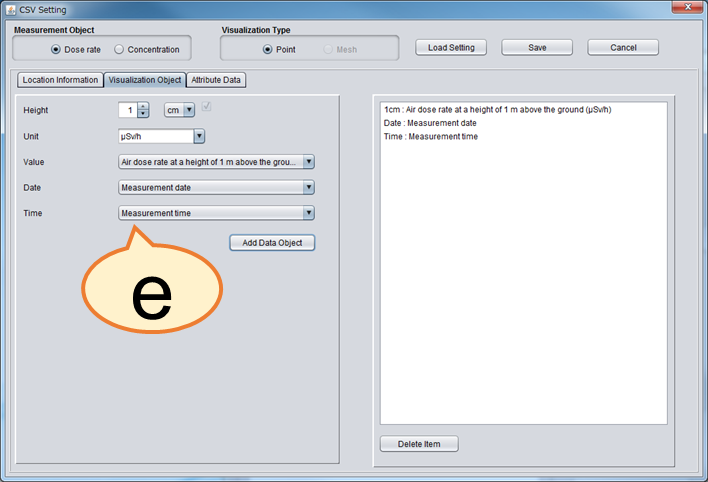
Time Series Graph
This function displays a graph depicting time series data at a specific measuring point (for example, a monitoring station) periodically.
The data is displayed in point form and the graph pops up when clicking a measurement point.
This function requires latitude, longitude, measured data, and measurement date/time.
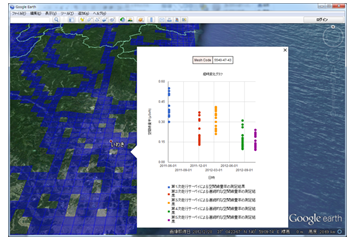
Chronological Graph
This function displays a graph depicting the variation of measured data over time from the multiple surveys (including car surveys) through different time periods.
Users select multiple surveys to create map and graphs.
Measured data are collected in a designated grid size and graph appears when clicking a grid cell.
This function requires latitude, longitude, measured data, and measurement date/time.
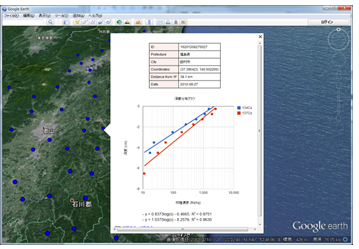
Correlation Graph
This function displays a graph depicting correlation of measured data from two surveys.
Users select two surveys to make a map and a correlation graph.
Average measured data for each designated grid cell is obtained for each survey.
The correlation graph is created with these averaged data of all grids cell. When clicking a grid cell, a correlation graph pops up.
This function requires measured data and corresponding latitude and longitude.
Data Japan Hydrographic Association
Data SIO, NOAA, U.S. Navy, NGA, GEBCO
Image Landsat
©2015 ZENRIN
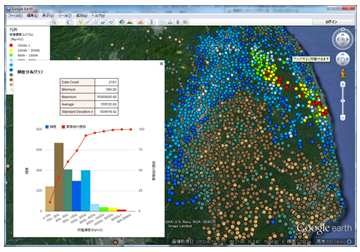
Frequency Distribution Graph
This function is for creating a map and a color coded histogram.
Relevant map and histogram are displayed when opening the KML in the Google Earth.
Users can redraw the graph from the side bar if the graph disappears after making some operation of the Google Earth.
Latitude, longitude, and measured data of each measurement point are required to create this type of map.