Japan Atomic Energy Agency (JAEA) regularly collects and publishes via an online database* environmental monitoring data related to the TEPCO Fukushima Daiichi Nuclear Power Plant accident, published by various organizations including the Secretariat of the Nuclear Regulation Authority, Fukushima Prefecture, research organizations, and so on. Gathered data are converted into a common file format (CSV format) suitable for analyzing the spatial distributions and temporal changes of radioactive materials. Geographical data useful for this analysis, such as elevation, soil, vegetation, land-use and snow coverage data etc. are also published on the same website. Various maps and graphs showing distributions of radioactive materials are also available on the website to promote intuitive understanding for users
What does this Database provide?
How to view distribution maps Page Top
1. Database top page
The top page displays category of surveys
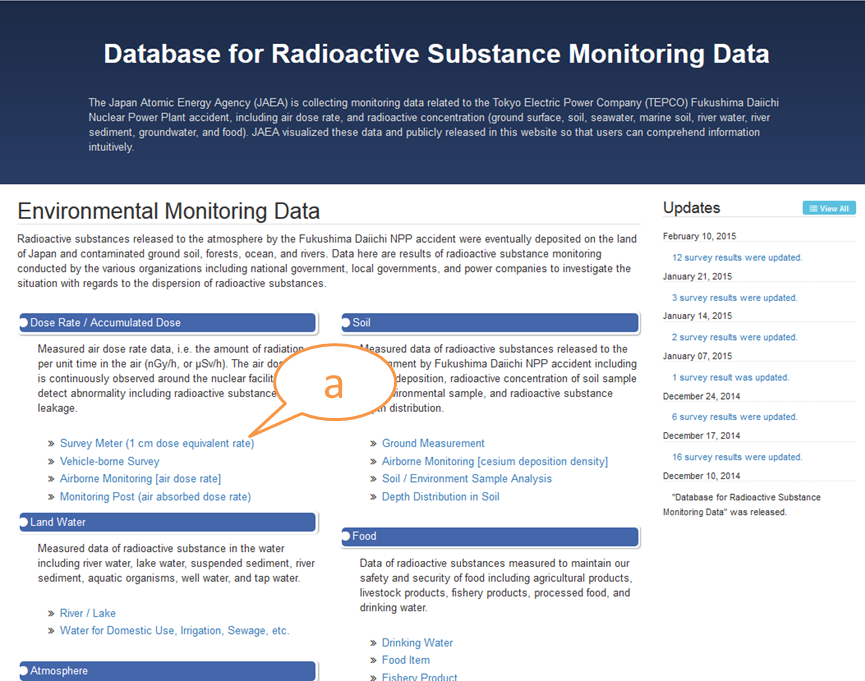
- (a) Choose the survey you want to see
2. Registered Data Catalogue
This page displays a list of surveys, with survey title, conductor, survey period, and brief a explanation for each survey.
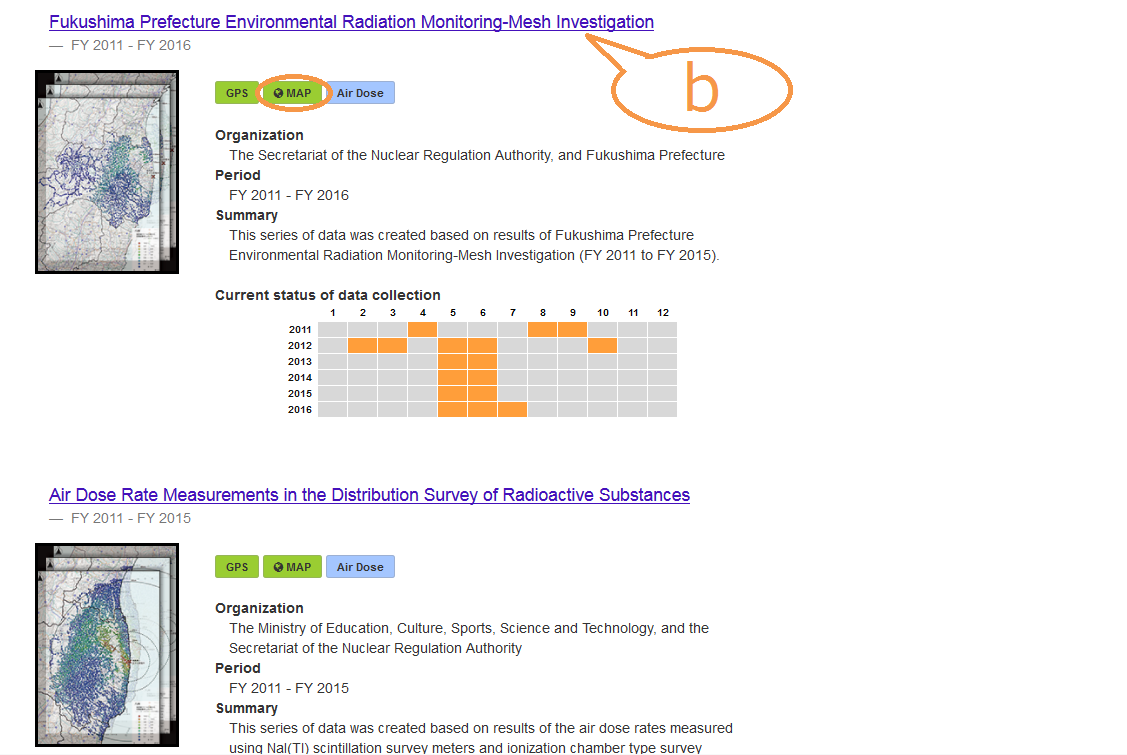
- (b) Choose the survey that shows ”Map” and click the title.
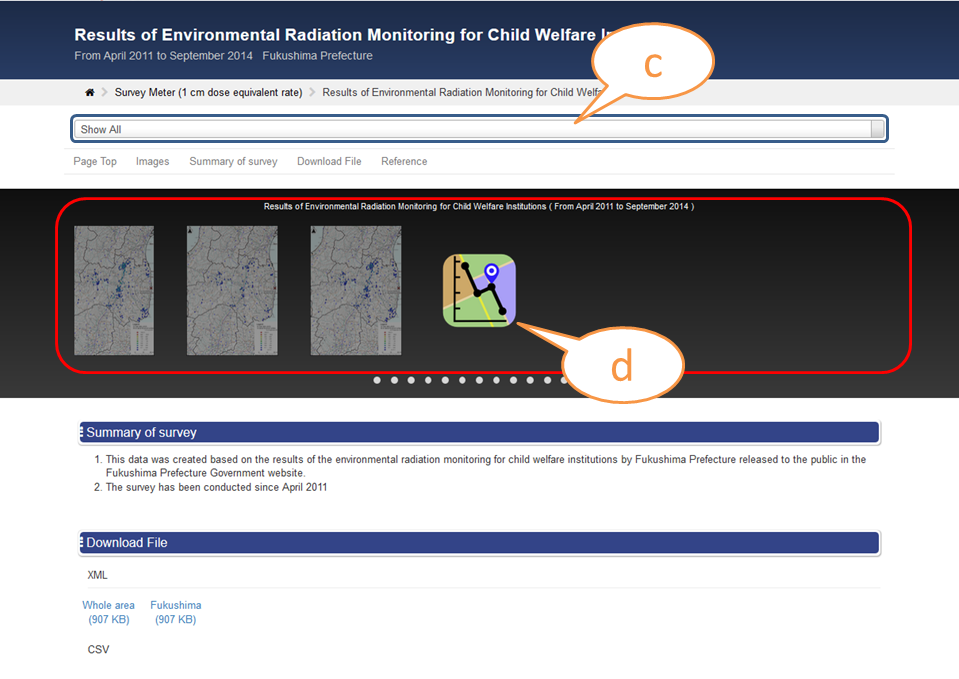
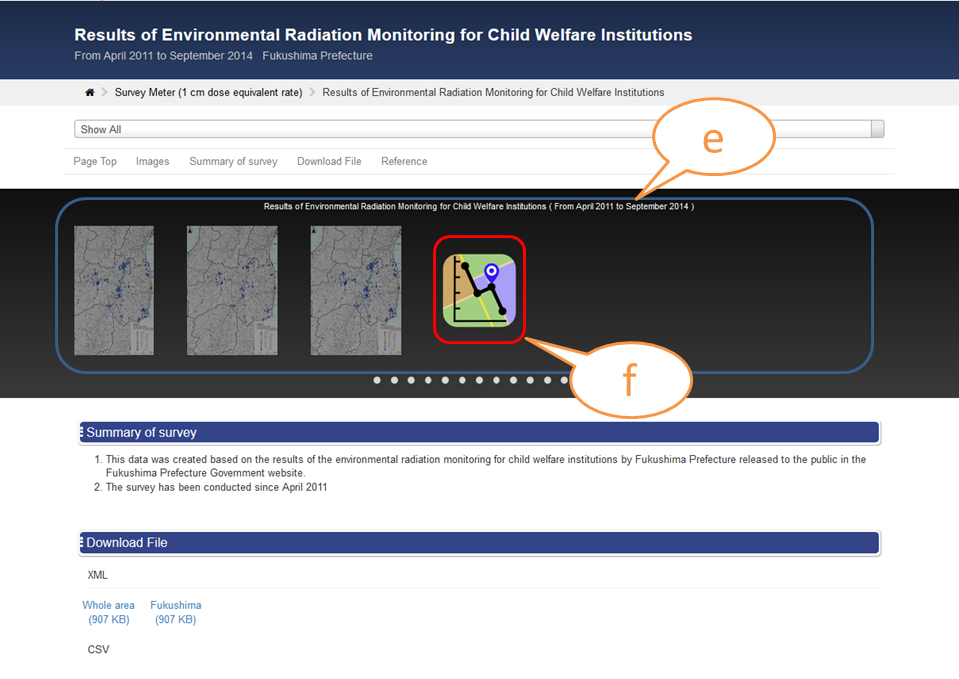
3. Portal page
This page shows a thumbnail, brief explanation, files for download, and reference links for each survey.
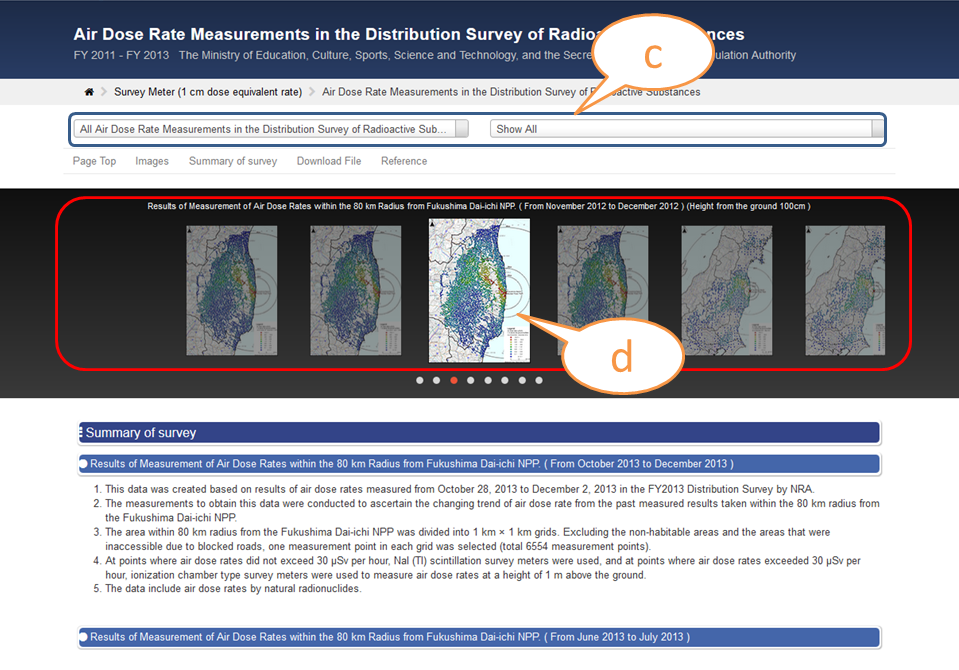
- (c) Using the pulldown selector, (d)filter thumbnails.
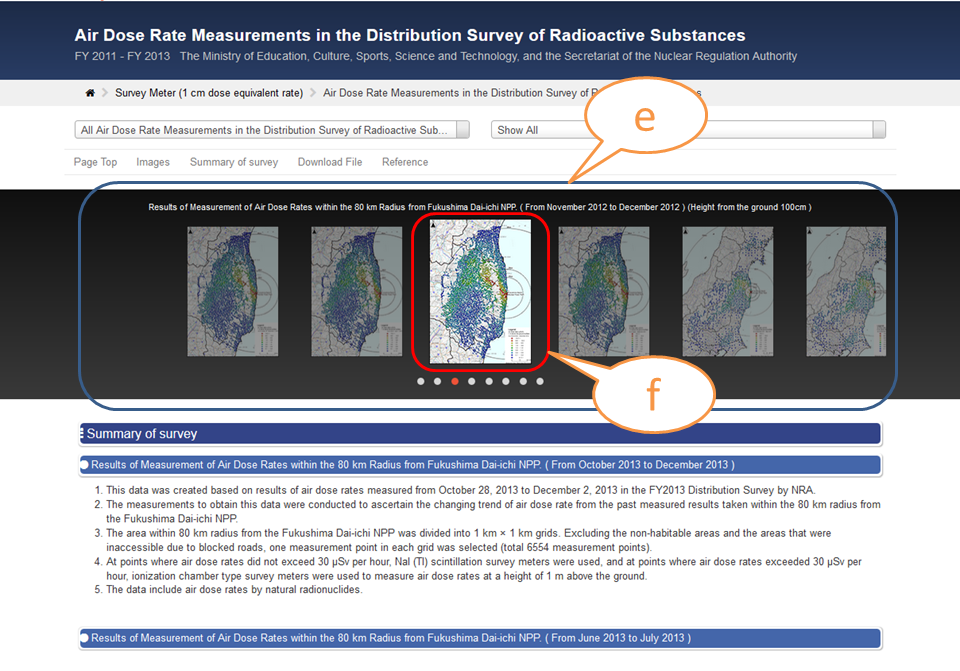
- (e) Drag and slide thumbnails
- (f) Click the thumbnail of the survey you are interested in.
4. Distribution map
An enlarged distribution map is displayed.
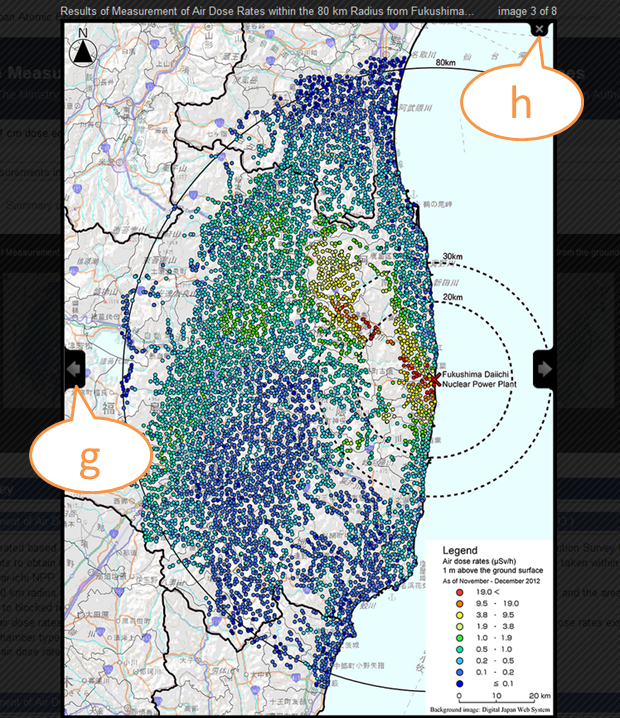
- (g) Click right or left arrow to see next map.

- (h) Click “x” button to go ”back to the portal page ”
How to view time change graphs Page Top
1. Database top page
The top page displays category of surveys
- (a) Choose the survey you want to see
2. Registered Data Catalogue
This page displays a list of surveys, with survey title, conductor, survey period, and brief a explanation for each survey.
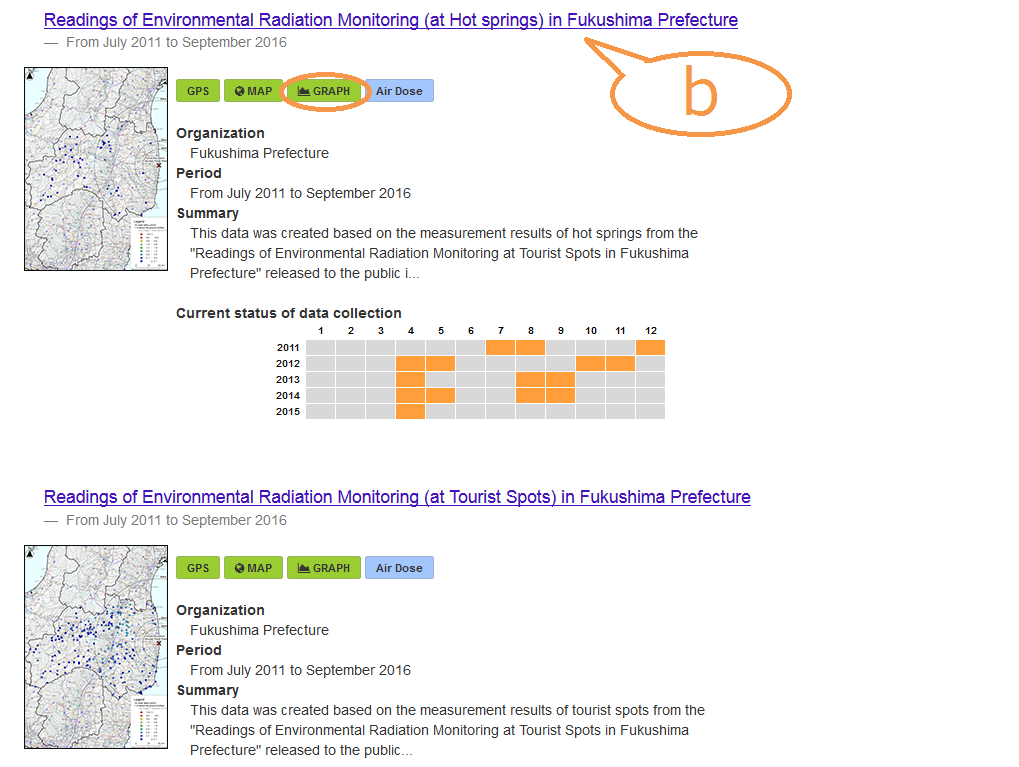
- (b) Choose the survey that shows "Graph" and click the title.
3. Portal page
This page shows a thumbnail, brief explanation, files for download, and reference links for each survey.
- (c) Using the pulldown selector, (d)filter thumbnails.
- (e) Drag and slide thumbnails
- (f) Click the thumbnail of the survey you are interested in.
4. Time change graph
Initially, only the map is displayed and graph section says “Select a marker on the map”.
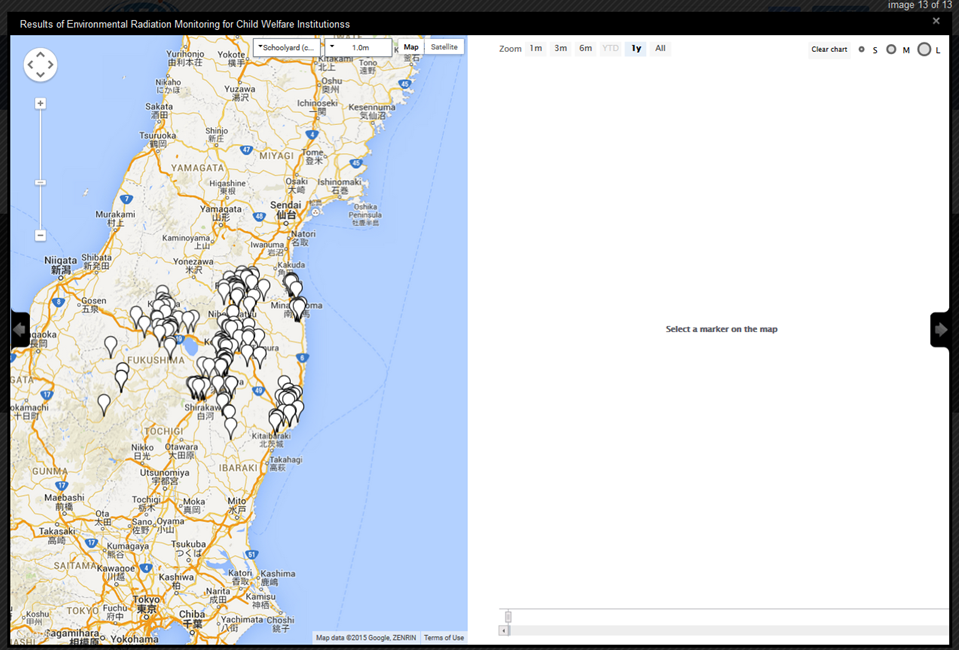
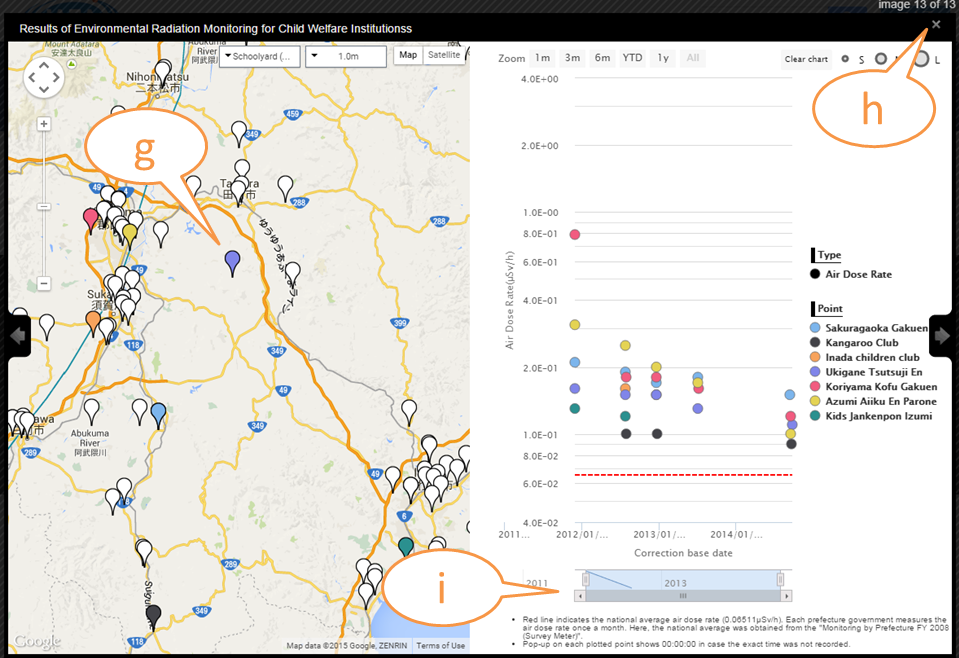
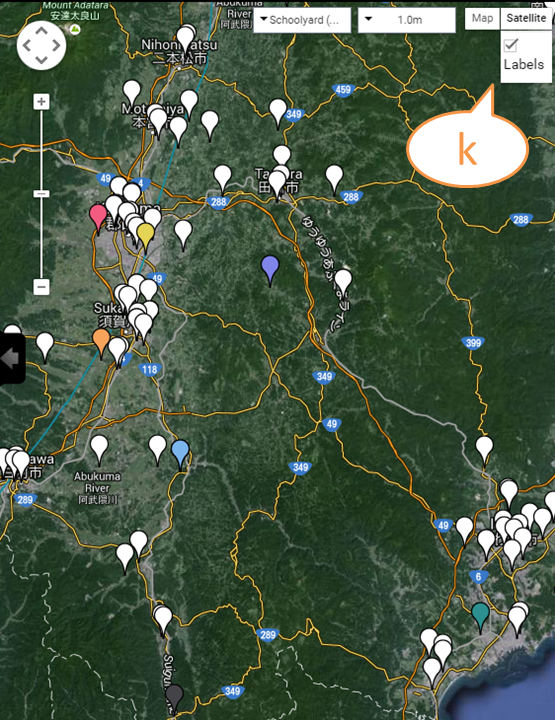
- (g) Select markers on the map that you would like to plot time change data for in the graph. The color of the map markers will match the colors used in the graph.
- (h) Click “x” button to go ”back to the portal page ”
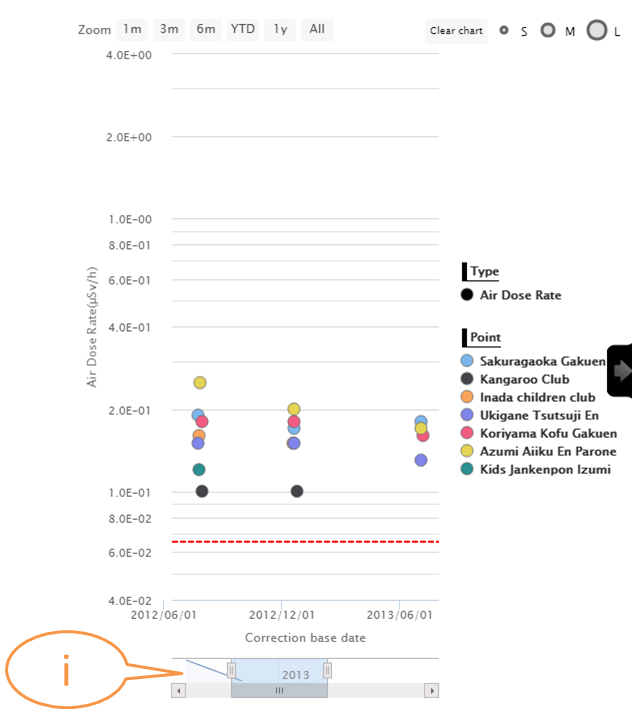
- (i) Adjust the displayed time period using the slider.
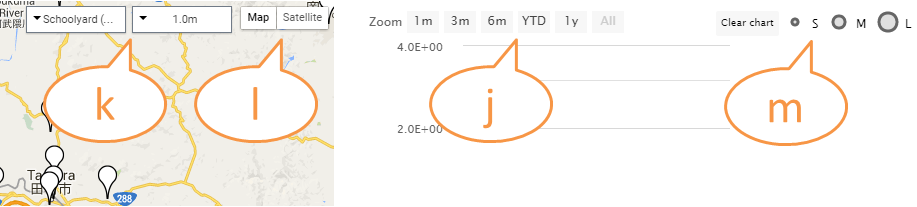
- (j) Zoom display period (1m: Last one month, 3m: Last three month, 6m: Last six month, YTD: Year-to-date, and 1y: Last one year).
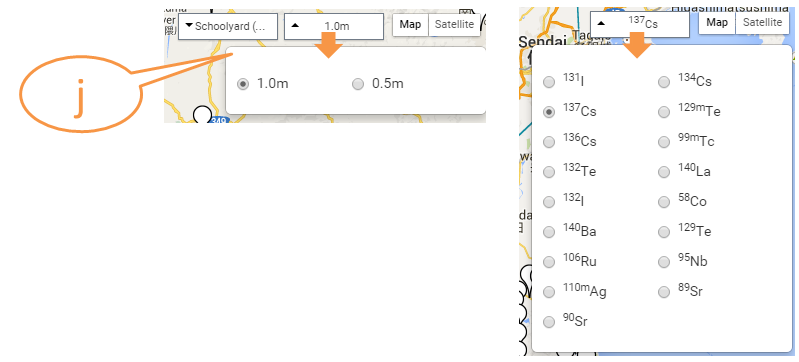
- (k) Using the selector, choose the item to draw a graph for (for example, Height in air dose rate measurement, or Nuclide in radioactivity substance analysis).
- (l) Click the 'Map' or 'Satellite' button to change the display mode of the map.
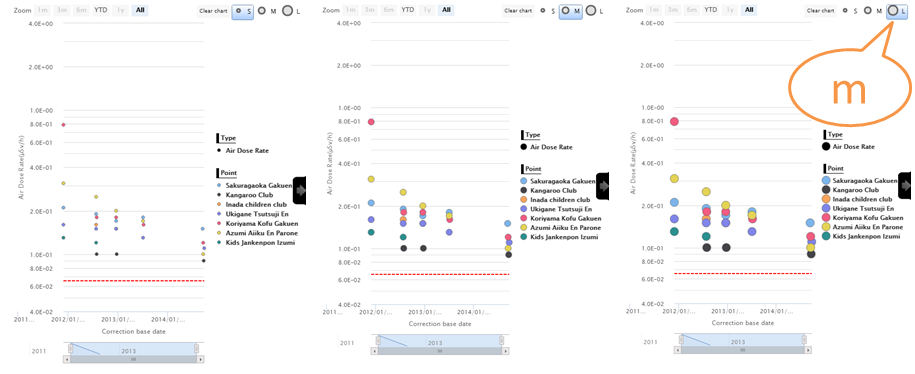
- (m) Choose dot size in the graph by clicking S (small), M (medium), or L (large). Clear chart by clicking “Clear chart”.
How to download files. Page Top
1. Download file
The section of download files shows up under both distribution maps and time change graphs
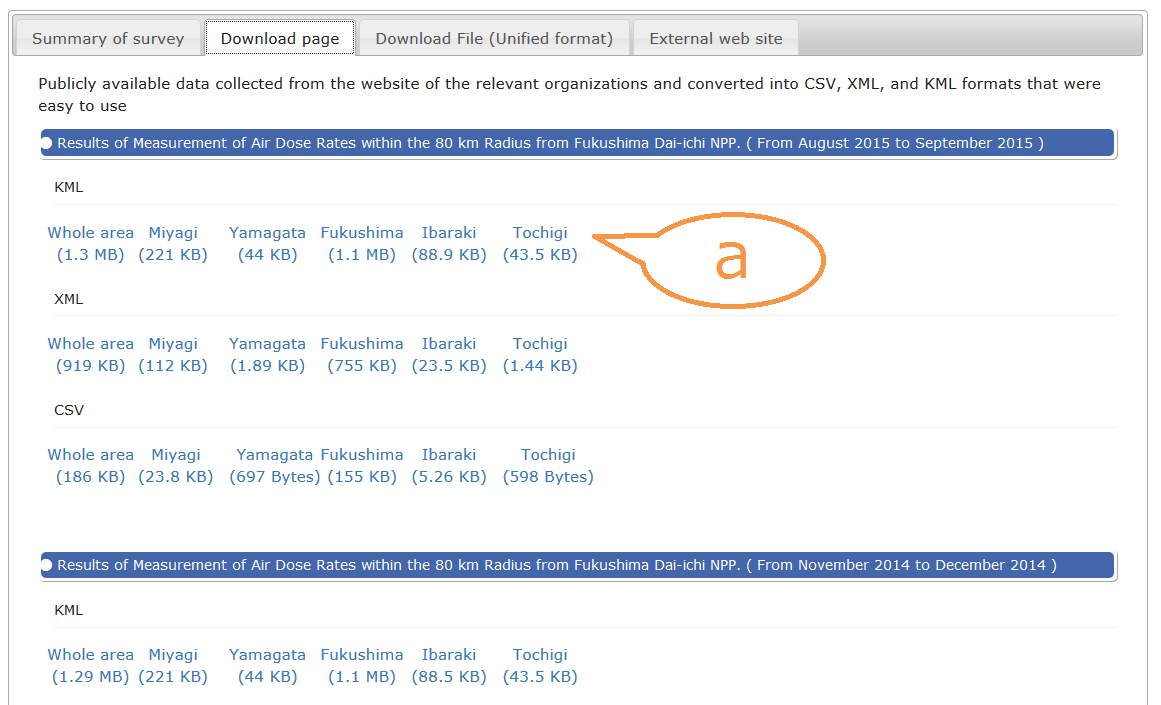
- (a) Click the link of the file you are interested to download.
- (b) Coordinates described in the data were derived based on the Japanese World Geodetic System JGD2000 (essentially identical to the World Geodetic System WGS84). In cases where the data released from the original source organization were described using the Former Japanese Geodetic System, the coordinates were converted to the Japanese World Geodetic System JGD2000.
2. Unified Format
In order to facilitate comparative analysis between different survey items, we prepared CSV files with common headers. The header structure is as follows.
Unified format for air dose rate measurement data
| Field No. | Header Name |
|---|---|
| 1 | Grid Code |
| 2 | Latitude |
| 3 | Longitude |
| 4 | Prefecture |
| 5 | City |
| 6 | Measurement Date and Time |
| 7 | Air dose rate at a height of 1 m |
Unified format for radionuclide concentration measurement data
| Field No. | Header Name |
|---|---|
| 1 | Grid Code |
| 2 | Latitude |
| 3 | Longitude |
| 4 | Prefecture |
| 5 | City |
| 6 | Measurement Date and Time |
| 7 | 137Cs Deposition density |
| 8 | 137Cs Detection limit |
| 9 | 137Cs Measurement Error |
| 10 | 134Cs Deposition density |
| 11 | 134Cs Detection limit |
| 12 | 134Cs Measurement Error |
3. Reference
The reference section shows up under the download section
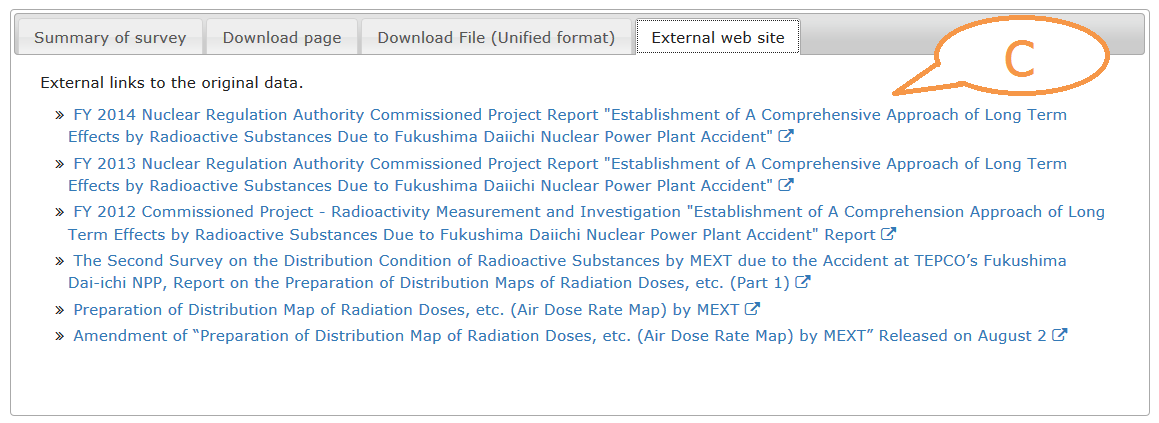
- (c) Click the link of the reference you would like to see.