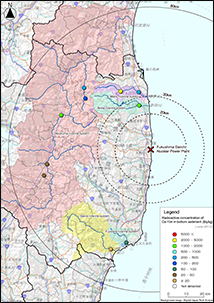
Results of the Nuclide Analysis of Bottom Sediment Sampled from Rivers and Riverside Soil in Fukushima Prefecture ( June 2013, November 2013 )
- In order to confirm the changing trend of the concentrations of radioactive substances in the bottom sediment, we conducted a subsequent survey to the third survey.
- In this survey, in order to confirm the changing trend of the concentrations of radioactive substances before and after typhoon season, the samplings were conducted in June 4 - June 6, 2013 as before typhoon season and November 12 - November 14, 2012 as after typhoon season.
- The analysis results show radiation (Bq) per unit weight (kg).
- In order to confirm the changing trend of the concentrations of radioactive substances, we took the bottom sediment from the same locations of the third survey (10 locations). When selecting locations to collect river samples (river water, bottom sediment, and suspended sediment), it was taken into consideration as the selection criteria that 1) the location should have a relatively high accumulated radioactive cesium based on the results of the land-based monitoring and airborne monitoring surveys, and 2) the place would be suitable for periodically measuring flow volumes, with a view to following the movement of radioactive substances in detail in the future. Based on these criteria, 57 locations were chosen. Out of 57 locations, 10 locations were chosen geographically evenly for sampling bottom sediment for the reason of survey and measurement period.
- Starting with this survey, we took riverside soil (10 locations) near the bottom sediment sampling point and analyzed the radioactive cesium in the riverside soil as well.
- Radioactivity concentration, error and detection limit at time of measurement.
- The analysis results were written to two significant figures. In the case when the count value was equal to or below three times the counting error, the detection limit was stated.
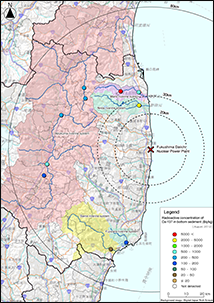
Results of the Nuclide Analysis of Bottom Sediment Sampled from Rivers in Fukushima Prefecture ( August 2012, November 2012 )
- In order to confirm the changing trend of the concentrations of radioactive substances in the bottom sediment, we conducted a subsequent survey to the first survey and the second survey.
- In this survey, in order to confirm the changing trend of the concentrations of radioactive substances before and after typhoon season, the samplings were conducted in August, 2012 (August 22 - 23) as before typhoon season and November, 2012 (November 27 - 28) as after typhoon season.
- The analysis results show radiation (Bq) per unit weight (kg).
- In order to confirm the changing trend of the concentrations of radioactive substances, we took the river water from the same locations of the first survey and the second survey. When selecting locations to collect river samples (river water, bottom sediment, and suspended sediment), it was taken into consideration as the selection criteria that 1) the location should have a relatively high accumulated radioactive cesium based on the results of the land-based monitoring and airborne monitoring surveys, and 2) the place would be suitable for periodically measuring flow volumes, with a view to following the movement of radioactive substances in detail in the future. Based on these criteria, 50 locations were chosen. Out of 50 locations, 10 locations were chosen geographically evenly for sampling bottom sediment and suspended sediment for the reason of survey and measurement period.
- Radioactivity concentration, error and detection limit at time of measurement.
- The analysis results were written to two significant figures. In the case when the count value was equal to or below three times the counting error, the detection limit was stated.
Results of the Nuclide Analysis of Bottom Sediment Sampled from Rivers in Fukushima Prefecture ( January 2012 )
- In order to confirm the changing trend of the concentrations of radioactive substances in the bottom sediment, we conducted a subsequent survey to the first survey.
- The analysis results show radiation (Bq) per unit weight (kg).
- When selecting locations to collect river samples (river water, bottom sediment, and suspended sediment), it was taken into consideration as the selection criteria that 1) the location should have a relatively high accumulated radioactive cesium based on the results of the land-based monitoring and airborne monitoring surveys, and 2) the place would be suitable for periodically measuring flow volumes, with a view to following the movement of radioactive substances in detail in the future. Based on these criteria, 50 locations were chosen. Out of 50 locations, 10 locations were chosen geographically evenly for sampling bottom sediment and suspended sediment for the reason of survey and measurement period.
- The bottom sediment sampling was conducted from December 20, 2011 to December 21, 2011
- Radioactivity concentration, error and detection limit at time of measurement
- Regarding 134Cs,137Cs and 131I, "ND" in the column "Radioactivity Concentration", "-" in the column "Error", and detection limit values in the column "detection limit": The peak of relevant nuclide was not clearly detected, or calculated radioactivity concentration was equal to or below 0.0. Reference value in the column "Radioactivity Concentration" smaller than the detection limit in the column "detection limit": The peak of the relevant nuclide was detected even though the calculated radioactivity concentration was below detection limit.
- Regarding 110mAg, 129mTe and 136Cs, "ND" in the column "Radioactivity Concentration" and "-" in the column "Error": The peak of relevant nuclide was not clearly detected, or calculated radioactivity concentration was below three times the error.
Results of the Nuclide Analysis of Bottom Sediment Sampled from Rivers in Fukushima Prefecture ( From July 2011 to August 2011 )
- The analysis results show radiation (Bq) per unit weight (kg).
- When selecting locations to collect river samples (river water, bottom sediment, and suspended sediment), it was taken into consideration as the selection criteria that 1) the location should have a relatively high accumulated radioactive cesium based on the results of the land-based monitoring and airborne monitoring surveys, and 2) the place would be suitable for periodically measuring flow volumes, with a view to following the movement of radioactive substances in detail in the future. Based on these criteria, 50 locations were chosen. Out of 50 locations, 10 locations were chosen geographically evenly for sampling bottom sediment and suspended sediment for the reason of survey and measurement period.
- In order to confirm the changing trend of the concentrations of radioactive substances in the bottom sediment, we conducted samplings twice within the period between June and October.
- Radioactivity concentration, error and detection limit at time of measurement
- Regarding 134Cs,137Cs and 131I, "ND" in the column "Radioactivity Concentration", "-" in the column "Error", and detection limit values in the column "detection limit": The peak of relevant nuclide was not clearly detected, or calculated radioactivity concentration was equal to or below 0.0. Reference value in the column "Radioactivity Concentration" smaller than the detection limit in the column "detection limit": The peak of the relevant nuclide was detected even though the calculated radioactivity concentration was below detection limit.
- Regarding 110mAg, 129mTe and 136Cs, "ND" in the column "Radioactivity Concentration" and "-" in the column "Error": The peak of relevant nuclide was not clearly detected, or calculated radioactivity concentration was below three times the error.


")
")
")
")
")
")
")
")
")
/large.png "Results of the Nuclide Analysis of Bottom Sediment Sampled from Rivers in Fukushima Prefecture ( August 2012, November 2012 )")
/large.png "Results of the Nuclide Analysis of Bottom Sediment Sampled from Rivers in Fukushima Prefecture ( August 2012, November 2012 )")
/large.png "Results of the Nuclide Analysis of Bottom Sediment Sampled from Rivers in Fukushima Prefecture ( August 2012, November 2012 )")
/large.png "Results of the Nuclide Analysis of Bottom Sediment Sampled from Rivers in Fukushima Prefecture ( August 2012, November 2012 )")
/large.png "Results of the Nuclide Analysis of Bottom Sediment Sampled from Rivers in Fukushima Prefecture ( August 2012, November 2012 )")
/large.png "Results of the Nuclide Analysis of Bottom Sediment Sampled from Rivers in Fukushima Prefecture ( August 2012, November 2012 )")
/large.png "Results of the Nuclide Analysis of Bottom Sediment Sampled from Rivers in Fukushima Prefecture ( August 2012, November 2012 )")
/large.png "Results of the Nuclide Analysis of Bottom Sediment Sampled from Rivers in Fukushima Prefecture ( August 2012, November 2012 )")
")
/large.png "Results of the Nuclide Analysis of Bottom Sediment Sampled from Rivers in Fukushima Prefecture ( January 2012 )")
/large.png "Results of the Nuclide Analysis of Bottom Sediment Sampled from Rivers in Fukushima Prefecture ( January 2012 )")
/large.png "Results of the Nuclide Analysis of Bottom Sediment Sampled from Rivers in Fukushima Prefecture ( January 2012 )")
/large.png "Results of the Nuclide Analysis of Bottom Sediment Sampled from Rivers in Fukushima Prefecture ( From July 2011 to August 2011 )")
/large.png "Results of the Nuclide Analysis of Bottom Sediment Sampled from Rivers in Fukushima Prefecture ( From July 2011 to August 2011 )")
/large.png "Results of the Nuclide Analysis of Bottom Sediment Sampled from Rivers in Fukushima Prefecture ( From July 2011 to August 2011 )")
/large.png "Results of the Nuclide Analysis of Bottom Sediment Sampled from Rivers in Fukushima Prefecture ( From July 2011 to August 2011 )")
/large.png "Results of the Nuclide Analysis of Bottom Sediment Sampled from Rivers in Fukushima Prefecture ( From July 2011 to August 2011 )")
/large.png "Results of the Nuclide Analysis of Bottom Sediment Sampled from Rivers in Fukushima Prefecture ( From July 2011 to August 2011 )")
")