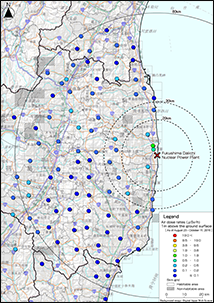
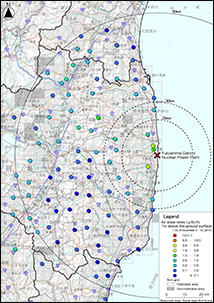
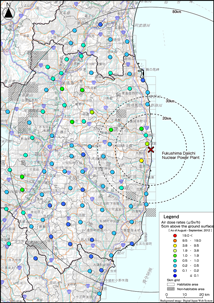
Results of the Measurement of Depth Distribution of Radioactive Cesium in Soil Using Scraper Plate ( from August 2016 to October 2016 )
- The analysis results show radiation (Bq) per unit weight (kg)(hereafter, radioactivity concentration).
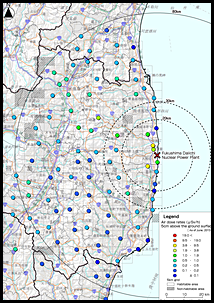
- Prior to the preparation of the data, in order to confirm the condition in the depth distribution of radioactive cesium comprehensively mainly within a 100 km radius of the Fukushima Dai-ichi NPP, we collected soil samples at various depths using scraper plate which is standard method to measure radioactive nuclides in soil profiles employed at IAEA and researched the depth distribution of radioactive cesium.
- To ascertain the time change of radioactive substances migrating in deeper ground, soil sampling was conducted at the same sampling points (85 points) as in the survey in December 2011 plus additional 6 points in coastal area (One sampling point was cancelled because of bank protection work).
- This year, soil sampling was from August 23 to October 11, 2016.
- Soil samplings were conducted for nine layers at 0 ~ 0.5, 0.5 ~ 1.0, 1.0 ~ 1.5, 1.5 ~ 2.0, 2.0 ~ 3.0, 3.0 ~ 4.0,4.0 ~ 5.0, 5.0 ~ 7.0, 7.0 ~ 10.0 cm from the ground surface, and the collected soil samples were put in U8 containers after stirring well. Quantitative analyses of radioactive cesium in the U8 soil samples were performed by fixed germanium semiconductor detectors.
- However, in the following collection sites where it was found that the transfer of radioactive cesium into the soil was remarkable, soil collection was carried out by changing the layer division.
- Fukushima Prefecture Futaba County Kawauchi Village Kamikawauchi Mochidome [N37°18'30.4" E140°47'12.8"]
- Fukushima Prefecture Sukagawa City [N37°18'28.6" E140°21'16.1"]
- Fukushima Prefecture Date City [N37°48'28.0" E140°38'49.1"]
The depths in the table correspond to actual depths as follows: | Depth Displayed (cm) | 0.0~0.5 | 0.5~1.0 | 1.0~1.5 | 1.5~2.0 | 2.0~3.0 | 3.0~4.0 | 4.0~5.0 | 5.0~7.0 | 7.0~10.0 | Actual Sampling Depth (cm) | 0.0~2.0 | 2.0~4.0 | 4.0~6.0 | 6.0~8.0 | 8.0~11.0 | 11.0~14.0 | 14.0~17.0 | 17.0~20.0 | 20.0~25.0 |
- The maximum value of radioactivity of radioactive cesium was found in the ground, and the following sampling sites considered to have been subjected to decontamination were subjected to soil collection by changing the layer division.
- Miyagi Prefecture IG-gun Marumori [N37°53'23.3" E140°46'16.0"]
- Fukushima Prefecture Fukushima City [N37°47'06.1" E140°25'20.1"]
The depths in the table correspond to actual depths as follows: | Depth Displayed (cm) | 0.0~0.5 | 0.5~1.0 | 1.0~1.5 | 1.5~2.0 | 2.0~3.0 | 3.0~4.0 | 4.0~5.0 | 5.0~7.0 | 7.0~10.0 | Actual Sampling Depth (cm) | 0.0~1.0 | 1.0~2.0 | 2.0~3.0 | 3.0~4.0 | 4.0~5.0 | 5.0~6.0 | 6.0~7.0 | 7.0~8.0 | 8.0~10.0 |
- Radioactivity concentration, error and detection limits are values as of measurement date.
- "ND" in the column "Deposition" and "-" in the column "Error": Calculated deposition density was below detection limit.
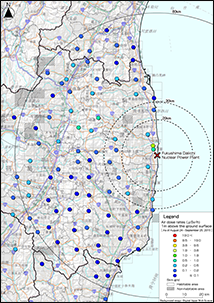
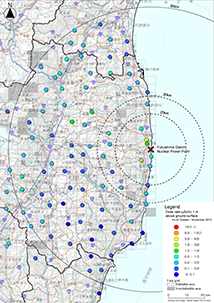
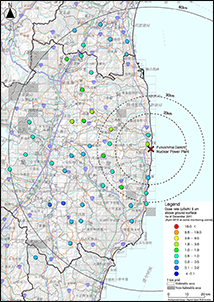
Results of the Measurement of Depth Distribution of Radioactive Cesium in Soil Using Scraper Plate ( from August 2015 to September 2015 )
- The analysis results show radiation (Bq) per unit weight (kg)(hereafter, radioactivity concentration).
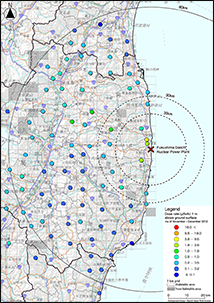
- Prior to the preparation of the data, in order to confirm the condition in the depth distribution of radioactive cesium comprehensively mainly within a 100 km radius of the Fukushima Dai-ichi NPP, we collected soil samples at various depths using scraper plate which is standard method to measure radioactive nuclides in soil profiles employed at IAEA and researched the depth distribution of radioactive cesium.
- To ascertain the time change of radioactive substances migrating in deeper ground, soil sampling was conducted at the same sampling points (85 points) as in the survey in December 2011 plus additional 6 points in coastal area (One sampling point was cancelled because of bank protection work).
- This year, soil sampling was from August 24 to September 25, 2014.
- Soil samplings were conducted for nine layers at 0 ~ 0.5, 0.5 ~ 1.0, 1.0 ~ 1.5, 1.5 ~ 2.0, 2.0 ~ 3.0, 3.0 ~ 4.0,4.0 ~ 5.0, 5.0 ~ 7.0, 7.0 ~ 10.0 cm from the ground surface, and the collected soil samples were put in U8 containers after stirring well. Quantitative analyses of radioactive cesium in the U8 soil samples were performed by fixed germanium semiconductor detectors.
- However, in the following collection sites where it was found that the transfer of radioactive cesium into the soil was remarkable, soil collection was carried out by changing the layer division.
- Fukushima Prefecture Futaba County Kawauchi Village Kamikawauchi Mochidome [N37°18'30.4" E140°47'12.8"]
- Fukushima Prefecture Sukagawa City [N37°18'28.6" E140°21'16.1"]
- Fukushima Prefecture Date City [N37°48'28.0" E140°38'49.1"]
The depths in the table correspond to actual depths as follows: | Depth Displayed (cm) | 0.0~0.5 | 0.5~1.0 | 1.0~1.5 | 1.5~2.0 | 2.0~3.0 | 3.0~4.0 | 4.0~5.0 | 5.0~7.0 | 7.0~10.0 | Actual Sampling Depth (cm) | 0.0~2.0 | 2.0~4.0 | 4.0~6.0 | 6.0~8.0 | 8.0~11.0 | 11.0~14.0 | 14.0~17.0 | 17.0~20.0 | 20.0~25.0 |
- The maximum value of radioactivity of radioactive cesium was found in the ground, and the following sampling sites considered to have been subjected to decontamination were subjected to soil collection by changing the layer division.
- Miyagi Prefecture IG-gun Marumori [N37°53'23.3" E140°46'16.0"]
- Fukushima Prefecture Fukushima City [N37°47'06.1" E140°25'20.1"]
The depths in the table correspond to actual depths as follows: | Depth Displayed (cm) | 0.0~0.5 | 0.5~1.0 | 1.0~1.5 | 1.5~2.0 | 2.0~3.0 | 3.0~4.0 | 4.0~5.0 | 5.0~7.0 | 7.0~10.0 | Actual Sampling Depth (cm) | 0.0~1.0 | 1.0~2.0 | 2.0~3.0 | 3.0~4.0 | 4.0~5.0 | 5.0~6.0 | 6.0~7.0 | 7.0~8.0 | 8.0~10.0 |
- Radioactivity concentration, error and detection limits are values as of measurement date.
- "ND" in the column "Deposition" and "-" in the column "Error": Calculated deposition density was below detection limit.
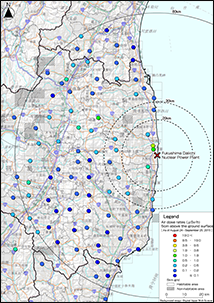
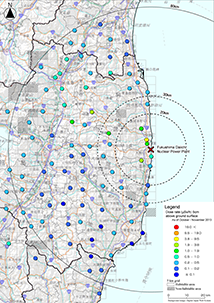
Results of the Measurement of Depth Distribution of Radioactive Cesium in Soil Using Scraper Plate ( November 2014 )
- The analysis results show radiation (Bq) per unit weight (kg)(hereafter, radioactivity concentration).
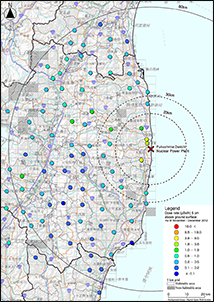
- Prior to the preparation of the data, in order to confirm the condition in the depth distribution of radioactive cesium comprehensively mainly within a 100 km radius of the Fukushima Dai-ichi NPP, we collected soil samples at various depths using scraper plate which is standard method to measure radioactive nuclides in soil profiles employed at IAEA and researched the depth distribution of radioactive cesium.
- To ascertain the time change of radioactive substances migrating in deeper ground, soil sampling was conducted at the same sampling points (85 points) as in the survey in December 2011 plus additional 6 points in coastal area (One sampling point was cancelled because of bank protection work). This year, soil sampling was conducted in two periods: from July 14 to July 24, 2014 (first period) and from November 4 to November 13, 2014 (second period). The data here was created based on the results from the second period.
- Soil samplings were conducted for nine layers at 0 ~ 0.5, 0.5 ~ 1.0, 1.0 ~ 1.5, 1.5 ~ 2.0, 2.0 ~ 3.0, 3.0 ~ 4.0,4.0 ~ 5.0, 5.0 ~ 7.0, 7.0 ~ 10.0 cm from the ground surface, and the collected soil samples were put in U8 containers after stirring well. Quantitative analyses of radioactive cesium in the U8 soil samples were performed by fixed germanium semiconductor detectors.
- However, in the following collection sites where it was found that the transfer of radioactive cesium into the soil was remarkable, soil collection was carried out by changing the layer division.
- Fukushima Prefecture Futaba County Kawauchi Village Kamikawauchi Mochidome [N37°18'29.8" E140°47'12.9"]
- Fukushima Prefecture Date City [N37°48'28.5" E140°38'48.4"]
The depths in the table correspond to actual depths as follows: | Depth Displayed (cm) | 0.0~0.5 | 0.5~1.0 | 1.0~1.5 | 1.5~2.0 | 2.0~3.0 | 3.0~4.0 | 4.0~5.0 | 5.0~7.0 | 7.0~10.0 | Actual Sampling Depth (cm) | 0.0~2.0 | 2.0~4.0 | 4.0~6.0 | 6.0~8.0 | 8.0~11.0 | 11.0~14.0 | 14.0~17.0 | 17.0~20.0 | 20.0~25.0 |
- The actual sampling depths of the following sampling points differ from the depths displayed in the data table.
- Miyagi Prefecture IG-gun Marumori[N37°53'23.4" E140°46'16.2"]
The depths in the table correspond to actual depths as follows: | Depth Displayed (cm) | 0.0~0.5 | 0.5~1.0 | 1.0~1.5 | 1.5~2.0 | 2.0~3.0 | 3.0~4.0 | 4.0~5.0 | 5.0~7.0 | 7.0~10.0 | Actual Sampling Depth (cm) | 0.0~1.0 | 1.0~2.0 | 2.0~3.0 | 3.0~4.0 | 4.0~5.0 | 5.0~6.0 | 6.0~7.0 | 7.0~8.0 | 8.0~10.0 |
- Radioactivity concentration, error and detection limits are values as of measurement date.
- "ND" in the column "Deposition" and "-" in the column "Error": Calculated deposition density was below detection limit.
Results of the Measurement of Depth Distribution of Radioactive Cesium in Soil Using Scraper Plate ( July 2014 )
- The analysis results show radiation (Bq) per unit weight (kg)(hereafter, radioactivity concentration).
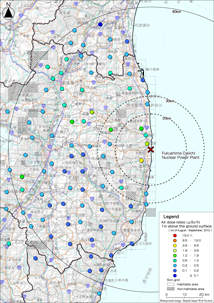
- Prior to the preparation of the data, in order to confirm the condition in the depth distribution of radioactive cesium comprehensively mainly within a 100 km radius of the Fukushima Dai-ichi NPP, we collected soil samples at various depths using scraper plate which is standard method to measure radioactive nuclides in soil profiles employed at IAEA and researched the depth distribution of radioactive cesium.
- To ascertain the time change of radioactive substances migrating in deeper ground, soil sampling was conducted at the same sampling points (85 points) as in the survey in December 2011 plus additional 6 points in coastal area (One sampling point was cancelled because of bank protection work). This year, soil sampling was conducted in two periods: from July 14 to July 24, 2014 (first period) and from November 4 to November 13, 2014 (second period). The data here was created based on the results from the second period.
- Soil samplings were conducted for nine layers at 0 ~ 0.5, 0.5 ~ 1.0, 1.0 ~ 1.5, 1.5 ~ 2.0, 2.0 ~ 3.0, 3.0 ~ 4.0,4.0 ~ 5.0, 5.0 ~ 7.0, 7.0 ~ 10.0 cm from the ground surface, and the collected soil samples were put in U8 containers after stirring well. Quantitative analyses of radioactive cesium in the U8 soil samples were performed by fixed germanium semiconductor detectors.
- However, in the following collection sites where it was found that the transfer of radioactive cesium into the soil was remarkable, soil collection was carried out by changing the layer division.
- Fukushima Prefecture Futaba County Kawauchi Village Kamikawauchi Mochidome [N37°18'29.8" E140°47'12.9"]
- Fukushima Prefecture Date City [N37°48'28.5" E140°38'48.4"]
The depths in the table correspond to actual depths as follows: | Depth Displayed (cm) | 0.0~0.5 | 0.5~1.0 | 1.0~1.5 | 1.5~2.0 | 2.0~3.0 | 3.0~4.0 | 4.0~5.0 | 5.0~7.0 | 7.0~10.0 | Actual Sampling Depth (cm) | 0.0~2.0 | 2.0~4.0 | 4.0~6.0 | 6.0~8.0 | 8.0~11.0 | 11.0~14.0 | 14.0~17.0 | 17.0~20.0 | 20.0~25.0 |
- The actual sampling depths of the following sampling points differ from the depths displayed in the data table.
- Miyagi Prefecture IG-gun Marumori[N37°53'23.4" E140°46'16.2"]
The depths in the table correspond to actual depths as follows: | Depth Displayed (cm) | 0.0~0.5 | 0.5~1.0 | 1.0~1.5 | 1.5~2.0 | 2.0~3.0 | 3.0~4.0 | 4.0~5.0 | 5.0~7.0 | 7.0~10.0 | Actual Sampling Depth (cm) | 0.0~1.0 | 1.0~2.0 | 2.0~3.0 | 3.0~4.0 | 4.0~5.0 | 5.0~6.0 | 6.0~7.0 | 7.0~8.0 | 8.0~10.0 |
- Radioactivity concentration, error and detection limits are values as of measurement date.
- "ND" in the column "Deposition" and "-" in the column "Error": Calculated deposition density was below detection limit.
Results of the Measurement of Depth Distribution of Radioactive Cesium in Soil Using Scraper Plate ( From October 2013 to November 2013 )
- The analysis results show radiation (Bq) per unit weight (kg)(hereafter, radioactivity concentration).
- Prior to the preparation of the data, in order to confirm the condition in the depth distribution of radioactive cesium comprehensively mainly within a 100 km radius of the Fukushima Dai-ichi NPP, we collected soil samples at various depths using scraper plate which is standard method to measure radioactive nuclides in soil profiles employed at IAEA and researched the depth distribution of radioactive cesium.
- To ascertain the time change of radioactive substances migrating in deeper ground, soil sampling was conducted at the same sampling points (85 points) as in the survey in December 2011 plus additional 6 points in coastal area (One sampling point was cancelled because of bank protection work). This year, soil sampling was conducted in two periods: from June 3 to June 27, 2013 (first period) and from October 28 to November 29, 2013 (second period). The data here was created based on the results from the second period.
- Soil samplings were conducted for nine layers at 0 ~ 0.5, 0.5 ~ 1.0, 1.0 ~ 1.5, 1.5 ~ 2.0, 2.0 ~ 3.0, 3.0 ~ 4.0,4.0 ~ 5.0, 5.0 ~ 7.0, 7.0 ~ 10.0 cm from the ground surface, and the collected soil samples were put in U8 containers after stirring well. Quantitative analyses of radioactive cesium in the U8 soil samples were performed by fixed germanium semiconductor detectors.
- Radioactivity concentration, error and detection limits are values as of measurement date.
- "ND" in the column "Deposition" and "-" in the column "Error": Calculated deposition density was below detection limit.
- The actual sampling depths of the following sampling points differ from the depths displayed in the data table.
- Fukushima Prefecture Futaba County Kawauchi Village Kamikawauchi Mochidome [N37°18'29.4" E140°47'13.1"]
- Fukushima Prefecture Date City Ryozenmachi Ohishi [N37°48'28.6" E140°38'48.4"]
The depths in the table correspond to actual depths as follows: | Depth Displayed (cm) | 0.0~0.5 | 0.5~1.0 | 1.0~1.5 | 1.5~2.0 | 2.0~3.0 | 3.0~4.0 | 4.0~5.0 | 5.0~7.0 | 7.0~10.0 | Actual Sampling Depth (cm) | 0.0~2.0 | 2.0~4.0 | 4.0~6.0 | 6.0~8.0 | 8.0~11.0 | 11.0~14.0 | 14.0~17.0 | 17.0~20.0 | 20.0~25.0 |
- The actual sampling depths of the following sampling points differ from the depths displayed in the data table.
- Fukushima Prefecture Futaba County Okumamachi Kumagawa[N37°23'12.5" E141° 2' 2.4"]
- Fukushima Prefecture Futaba County Tomiokamachi Hotokehama Kamaden [N37°20'18.4" E141° 1'37.5"]
- Fukushima Prefecture Futaba County Narahamachi Yamadaoka Shimoiwasawa[N37°14'29.6" E141° 0'47.5"]
- Fukushima Prefecture Iwaki City Tairausuiso Kozuka[N37° 0' 0.2" E140°58'46.1"]
The depths in the table correspond to actual depths as follows: | Depth Displayed (cm) | 0.0~0.5 | 0.5~1.0 | 1.0~1.5 | 1.5~2.0 | 2.0~3.0 | 3.0~4.0 | 4.0~5.0 | 5.0~7.0 | 7.0~10.0 | Actual Sampling Depth (cm) | 0.0~3.0 | 3.0~6.0 | 6.0~9.0 | 1.0~12.0 | 12.0~15.0 | 15.0~18.0 | 18.0~21.0 | 21.0~24.0 | 24.0~27.0 |
Results of the Measurement of Depth Distribution of Radioactive Cesium in Soil Using Scraper Plate ( June 2013 )
- The analysis results show radiation (Bq) per unit weight (kg)(hereafter, radioactivity concentration).
- Prior to the preparation of the data, in order to confirm the condition in the depth distribution of radioactive cesium comprehensively mainly within a 100 km radius of the Fukushima Dai-ichi NPP, we collected soil samples at various depths using scraper plate which is standard method to measure radioactive nuclides in soil profiles employed at IAEA and researched the depth distribution of radioactive cesium.
- To ascertain the time change of radioactive substances migrating in deeper ground, soil sampling was conducted at the same sampling points (85 points) as in the survey in December 2011 plus additional 6 points in coastal area. This year, soil sampling was conducted in two periods: from June 2013 (first period) and from October to November 2013 (second period). The data here was created based on the results from the first period.
- Soil samplings were conducted for nine layers at 0 ~ 0.5, 0.5 ~ 1.0, 1.0 ~ 1.5, 1.5 ~ 2.0, 2.0 ~ 3.0, 3.0 ~ 4.0,4.0 ~ 5.0, 5.0 ~ 7.0, 7.0 ~ 10.0 cm from the ground surface, and the collected soil samples were put in U8 containers after stirring well. Quantitative analyses of radioactive cesium in the U8 soil samples were performed by fixed germanium semiconductor detectors.
- Radioactivity concentration, error and detection limits are values as of measurement date.
- "ND" in the column "Radioactivity concentration" and "-" in the column "Error": Measured radioactivity concentration was below detection limit.
Results of the Measurement of Depth Distribution of Radioactive Cesium in Soil Using Scraper Plate ( From November 2012 to December 2012 )
- The analysis results show radiation (Bq) per unit weight (kg).
- Prior to the preparation of the data, in order to confirm the condition in the depth distribution of radioactive cesium comprehensively mainly within a 80 km radius of the Fukushima Dai-ichi NPP, we collected soil samples at various depths using scraper plate which is standard method to measure radioactive nuclides in soil profiles employed at IAEA and researched the depth distribution of radioactive cesium.
- In this survey, in order to ascertain the time change of the migration of radionuclides into the soil, we generally took soil samples from the same locations of the survey in December, 2011. The soil samplings were also conducted in the end of August, 2012 (August 21 - September 5, and September 26) and the end of November, 2012 (November 26 - December 7, and December 21) to ascertain the changing trend of depth distribution of radioactive cesium in the soil before and after typhoon season. The data shown here are measured results after typhoon season.
- Soil samplings were conducted for eight layers at 0 ~ 0.5, 0.5 ~ 1.0, 1.0 ~ 1.5, 1.5 ~ 2.0, 2.0 ~ 3.0, 3.0 ~ 4.0, 4.0 ~ 5.0, 5.0 ~ 8.0 cm from the ground surface, and the collected soil samples were put in the U8 containers. Using fixed germanium semiconductor detectors, nuclide analyses of the soil samples in U8 containers were conducted.
- Radioactivity concentrations, errors, and detection limits show decay-compensated values at sampling date.
- "ND" in the column "Deposition" and "-" in the column "Error": Calculated deposition density was below detection limit.
- Sampling No. 16201211300048 (Fukushima prefecture Futaba ward Kawauchi villiage, N37°18'29.7", E140°47'13.1") : Actual sampling depths differ from the depths displayed in the table above. The depths in the table correspond to actual depths as follows:
| Depth Displayed (cm) | 0.0 ~ 0.5 | 0.5 ~ 1.0 | 1.0 ~ 1.5 | 1.5 ~ 2.0 | 2.0 ~ 3.0 | 3.0 ~ 4.0 | 4.0 ~ 5.0 | 5.0 ~ 8.0 | Actual Sampling Depth (cm) | 0.0 ~ 2.0 | 2.0 ~ 4.0 | 4.0 ~ 6.0 | 6.0 ~ 8.0 | 8.0 ~ 11.0 | 11.0 ~ 14.0 | 14.0 ~ 17.0 | 17.0 ~ 20.0 |
Results of the Measurement of Depth Distribution of Radioactive Cesium in Soil Using Scraper Plate ( From August 2012 to September 2012 )
- The analysis results show radiation (Bq) per unit weight (kg).
- Prior to the preparation of the data, in order to confirm the condition in the depth distribution of radioactive cesium comprehensively mainly within an 80 km radius of the Fukushima Dai-ichi NPP, we collected soil samples at various depths using scraper plate which is the standard method employed by IAEA to measure radioactive nuclides in soil profiles, and researched the depth distribution of radioactive cesium.
- In this survey, in order to ascertain the time change of the migration of radionuclides into the soil, we generally took soil samples from the same locations of the survey in December, 2011. The soil samplings were also conducted in the end of August, 2012 (August 21 - September 5, and September 26) and the end of November, 2012 (November 26 - December 7, and December 21) to ascertain the changing trend of depth distribution of radioactive cesium in the soil before and after typhoon season. The data shown here are measured results before typhoon season.
- Soil samplings were conducted for eight layers at 0 ~ 0.5, 0.5 ~ 1.0, 1.0 ~ 1.5, 1.5 ~ 2.0, 2.0 ~ 3.0, 3.0 ~ 4.0, 4.0 ~ 5.0, 5.0 ~ 8.0 cm from the ground surface, and the collected soil samples were put in the U8 containers. Using fixed germanium semiconductor detectors, nuclide analyses of the soil samples in U8 containers were conducted.
- Radioactivity concentrations, errors, and detection limits show decay-compensated values at sampling date.
- "ND" in the column "Deposition" and "-" in the column "Error": Calculated deposition density was below detection limit.
Results of the Measurement of Depth Distribution of Radioactive Cesium in Soil Using Scraper Plate ( December 2011, April 2012 )
- The analysis results show radiation (Bq) per unit weight (kg).
- Prior to the preparation of the data, in order to confirm the condition in the depth distribution of radioactive cesium comprehensively mainly within a 80 km radius of the Fukushima Dai-ichi NPP, we collected soil samples at various depths using scraper plate which is standard method to measure radioactive nuclides in soil profiles employed at IAEA and researched the depth distribution of radioactive cesium.
- The samples of soil were collected (at 3 locations) from Apr 17 to Apr 19, 2011 for the areas within 20 km from the Fukushima Dai-ichi NPP, and collected (at 81 locations) from Dec 12 to Dec 22, 2011 for the areas between 20 and 80 km from the Fukushima Dai-ichi NPP.
- Soil samplings were conducted for eight layers at 0 ~ 0.5, 0.5 ~ 1.0, 1.0 ~ 1.5, 1.5 ~ 2.0, 2.0 ~ 3.0, 3.0 ~ 4.0,4.0 ~ 5.0, 5.0 ~ 8.0 cm from the ground surface, and the collected soil samples were put in the U8 containers.
- Radioactivity concentrations, errors, and detection limits show decay-compensated values at sampling date.
- "ND" in the column "Deposition" and "-" in the column "Error": Calculated deposition density was below detection limit.
- Blank in the column "Air Dose Rate": Air dose rate was not measured at the soil sampling point.