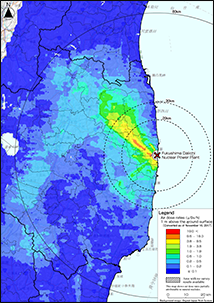
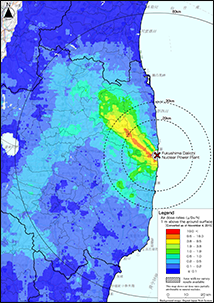
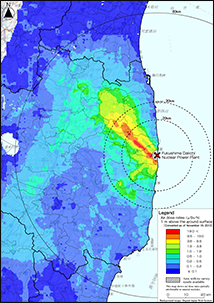

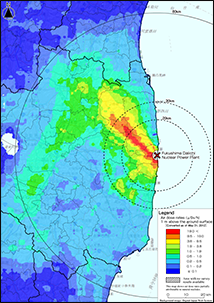
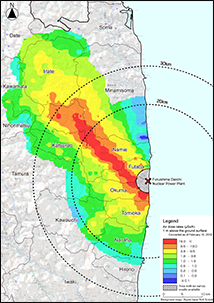


Air Dose Rate Measurement Results at the Height of 1 m above the Ground in Fukushima Prefecture and the Neighboring Prefectures (As of November 16, 2017 (80th Month After the Accident)) ( Decay correction: November 16, 2017 )
- This data was created based on the measurement results of the airborne monitoring survey in Fukushima Prefecture and the neighboring prefectures by the Secretariat of the Nuclear Regulation Authority (As of November 16, 2017 (80th month after the accident)).
- The data published here was prepared based on the results of the airborne monitoring in Fukushima Prefecture and the neighboring prefectures on November 16, 2017, and the 80 km range of Fukushima Dai-ichi NPP on September 25, 2017.
- Their flight altitudes were about 300 m above ground, and the air dose rate at the ground surface is the averaged value of air dose rates in a roughly about 600 m diameter circle (varies by flight altitude) below the aircraft.
- In order to prepare air dose rates, we first obtained the relation between counting rates (cps) measured in the air (150 - 900 m) above the test line established at each of the monitoring areas and air dose rates (µSv/h) at the height of 1 m above the ground measured around the test line using NaI scintillators, and then calculated air dose rates at the height of 1 m above the ground using counting rates measured in the air above the respective measuring points. The data include air dose rates by natural radionuclides.
- The values have been decay-compensated to the value for November 16, 2017, which is the final day in which the airborne monitoring survey in Fukushima Prefecture and the neighboring prefectures was conducted. Decay-compensated air dose rates were obtained by subtracting the average air dose rates due to natural radionuclides from the measured values and then considering physical attenuation of Cs-134 and Cs-137 from the measurement time up to a certain point in time (November 16, 2017) (For detailed information about the method, see Attachment 9, Results of Airborne Monitoring Survey by MEXT in the Kyushu Region and Okinawa Prefecture, May 11, 2012).
- The data consists of air dose rates at the median points of the Quarter Grid Squares (approximately 250 m x 250 m) defined by JIS X 0410. See the Ministry of Internal Affairs and Communications Statistics Bureau website for "Grid Square Statistics".
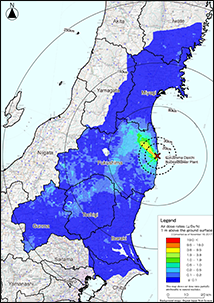
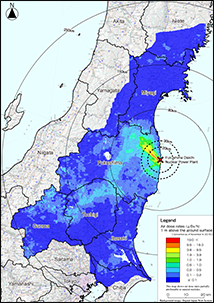
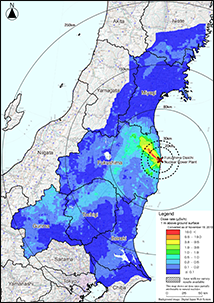
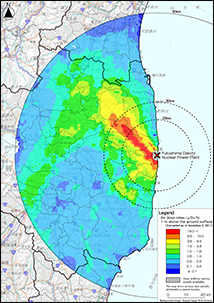
Air Dose Rate Measurement Results at the Height of 1 m above the Ground in Fukushima Prefecture and the Neighboring Prefectures (As of November 18, 2016 (68th Month After the Accident)) ( Decay correction: November 18, 2016 )
- This data was created based on the measurement results of the airborne monitoring survey in Fukushima Prefecture and the neighboring prefectures by the Secretariat of the Nuclear Regulation Authority (As of November 18, 2016 (68th month after the accident)).
- The data published here was prepared based on the results obtained from September 14 to November 18, 2016 for the airborne monitoring in Fukushima Prefecture and the neighboring prefectures, and from October 15, 2016 for the 80 km range of Fukushima Dai-ichi NPP.
- Their flight altitudes were about 300 m above ground, and the air dose rate at the ground surface is the averaged value of air dose rates in a roughly about 600 m diameter circle (varies by flight altitude) below the aircraft.
- In order to prepare air dose rates, we first obtained the relation between counting rates (cps) measured in the air ( 150 - 900 m) above the test line established at each of the monitoring areas and air dose rates (µSv/h) at the height of 1 m above the ground measured around the test line using NaI scintillators, and then calculated air dose rates at the height of 1 m above the ground using counting rates measured in the air above the respective measuring points. The data include air dose rates by natural radionuclides.
- The values have been decay-compensated to the value for November 18, 2016, which is the final day in which the airborne monitoring survey in Fukushima Prefecture and the neighboring prefectures was conducted. Decay-compensated air dose rates were obtained by subtracting the average air dose rates due to natural radionuclides from the measured values and then considering physical attenuation of Cs-134 and Cs-137 from the measurement time up to a certain point in time (November 18, 2016) (For detailed information about the method, see Attachment 9, Results of Airborne Monitoring Survey by MEXT in the Kyushu Region and Okinawa Prefecture, May 11, 2012).
- The data consists of air dose rates at the median points of the Quarter Grid Squares (approximately 250 m x 250 m) defined by JIS X 0410. See the Ministry of Internal Affairs and Communications Statistics Bureau website for "Grid Square Statistics".
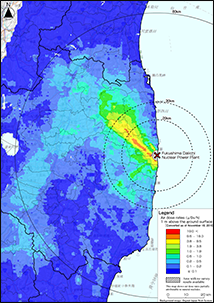
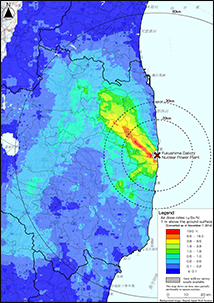
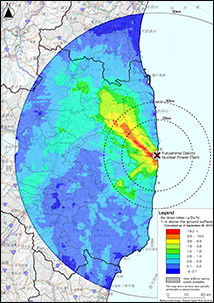
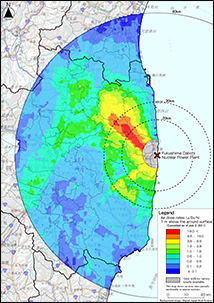
Air Dose Rate Measurement Results at the Height of 1 m above the Ground in Fukushima Prefecture and the Neighboring Prefectures (As of November 4, 2015 (56th Month After the Accident)) ( Decay correction: November 4, 2015 )
- This data was created based on the measurement results of the airborne monitoring survey in Fukushima Prefecture and the neighboring prefectures by the Secretariat of the Nuclear Regulation Authority (As of November 4, 2015 (56th month after the accident)).
- The data published here was prepared based on the results obtained from September 12 to September 30, 2015 for the airborne monitoring in Fukushima Prefecture and the neighboring prefectures (total 47 flights), and from October 2 to November 4, 2015 (total 94 flights) for the 80 km range of Fukushima Dai-ichi NPP.
- Their flight altitudes were about 300 m above ground, and the air dose rate at the ground surface is the averaged value of air dose rates in a roughly about 600 m diameter circle (varies by flight altitude) below the aircraft.
- In order to prepare air dose rates, we first obtained the relation between counting rates (cps) measured in the air ( 150 - 900 m) above the test line established at each of the monitoring areas and air dose rates (µSv/h) at the height of 1 m above the ground measured around the test line using NaI scintillators, and then calculated air dose rates at the height of 1 m above the ground using counting rates measured in the air above the respective measuring points. The data include air dose rates by natural radionuclides.
- The values have been decay-compensated to the value for November 4, 2015, which is the final day in which the airborne monitoring survey in Fukushima Prefecture and the neighboring prefectures was conducted. Decay-compensated air dose rates were obtained by subtracting the average air dose rates due to natural radionuclides from the measured values and then considering physical attenuation of Cs-134 and Cs-137 from the measurement time up to a certain point in time (November 4, 2015) (For detailed information about the method, see Attachment 9, Results of Airborne Monitoring Survey by MEXT in the Kyushu Region and Okinawa Prefecture, May 11, 2012).
- The data consists of air dose rates at the median points of the Quarter Grid Squares (approximately 250 m x 250 m) defined by JIS X 0410. See the Ministry of Internal Affairs and Communications Statistics Bureau website for "Grid Square Statistics".
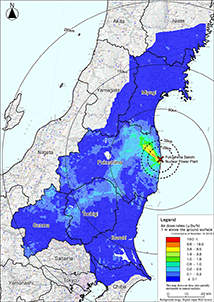
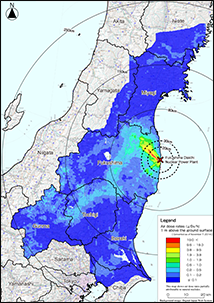
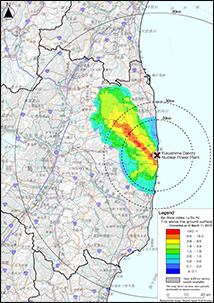
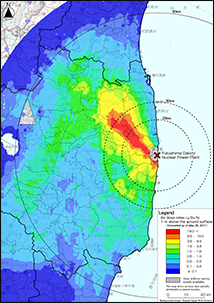
Air Dose Rate Measurement Results at the Height of 1 m above the Ground in Fukushima Prefecture and the Neighboring Prefectures (As of November 7, 2014 (44th Month After the Accident)) ( Decay correction: November 7, 2014 )
- This data was created based on the measurement results of the airborne monitoring survey in Fukushima Prefecture and the neighboring prefectures by the Secretariat of the Nuclear Regulation Authority (As of November 7, 2014 (44th month after the accident)).
- The data published here was prepared based on the results obtained from September 1 to September 20, 2014 for the airborne monitoring in Fukushima Prefecture and the neighboring prefectures (total 40 flights), and from September 21 to November 7, 2014 (total 109 flights) for the 80 km range of Fukushima Dai-ichi NPP.
- Their flight altitudes were about 300 m above ground, and the air dose rate at the ground surface is the averaged value of air dose rates in a roughly about 600 m diameter circle (varies by flight altitude) below the aircraft.
- In order to prepare air dose rates, we first obtained the relation between counting rates (cps) measured in the air ( 150 - 900 m) above the test line established at each of the monitoring areas and air dose rates (µSv/h) at the height of 1 m above the ground measured around the test line using NaI scintillators, and then calculated air dose rates at the height of 1 m above the ground using counting rates measured in the air above the respective measuring points. The data include air dose rates by natural radionuclides.
- The values have been decay-compensated to the value for November 7, 2014, which is the final day in which the airborne monitoring survey in Fukushima Prefecture and the neighboring prefectures was conducted. Decay-compensated air dose rates were obtained by subtracting the average air dose rates due to natural radionuclides from the measured values and then considering physical attenuation of Cs-134 and Cs-137 from the measurement time up to a certain point in time (November 7, 2014) (For detailed information about the method, see Attachment 9, Results of Airborne Monitoring Survey by MEXT in the Kyushu Region and Okinawa Prefecture, May 11, 2012).
- The data consists of air dose rates at the median points of the Quarter Grid Squares (approximately 250 m x 250 m) defined by JIS X 0410. See the Ministry of Internal Affairs and Communications Statistics Bureau website for "Grid Square Statistics".
Air Dose Rate Measurement Results at the Height of 1 m above the Ground in Fukushima Prefecture and the Neighboring Prefectures (As of November 19, 2013 (32nd Month After the Accident)) ( Decay correction: November 19, 2013 )
- This data was created based on the measurement results of the airborne monitoring survey in Fukushima Prefecture and the neighboring prefectures by the Secretariat of the Nuclear Regulation Authority (As of November 19, 2013 (32nd month after the accident)).
- The data published here was prepared based on the results obtained from September 3 to November 4, 2013 for the airborne monitoring in Fukushima Prefecture and the neighboring prefectures (total 113 flights), and from November 2 to November 19, 2013 (total 48 flights) for the 80 km range of Fukushima Dai-ichi NPP.
- Their flight altitudes were about 300 m above ground, and the air dose rate at the ground surface is the averaged value of air dose rates in a roughly about 600 m diameter circle (varies by flight altitude) below the aircraft.
- In order to prepare air dose rates, we first obtained the relation between counting rates (cps) measured in the air ( 150 - 900 m) above the test line established at each of the monitoring areas and air dose rates (µSv/h) at the height of 1 m above the ground measured around the test line using NaI scintillators, and then calculated air dose rates at the height of 1 m above the ground using counting rates measured in the air above the respective measuring points. The data include air dose rates by natural radionuclides.
- The values have been decay-compensated to the value for November 19, 2013, which is the final day in which the airborne monitoring survey in Fukushima Prefecture and the neighboring prefectures was conducted. Decay-compensated air dose rates were obtained by subtracting the average air dose rates due to natural radionuclides from the measured values and then considering physical attenuation of Cs-134 and Cs-137 from the measurement time up to a certain point in time (November 19, 2013) (For detailed information about the method, see Attachment 9, Results of Airborne Monitoring Survey by MEXT in the Kyushu Region and Okinawa Prefecture, May 11, 2012).
- The data consists of air dose rates at the median points of the Quarter Grid Squares (approximately 250 m x 250 m) defined by JIS X 0410. See the Ministry of Internal Affairs and Communications Statistics Bureau website for "Grid Square Statistics".
Air Dose Rate Results of the Seventh Airborne Monitoring Survey ( Decay correction: September 28, 2013 )
- This data was created based on the measurement results of the seventh airborne monitoring survey by the Secretariat of the Nuclear Regulation Authority.
- This published data was prepared based on the results obtained from August 27 to September 28, 2013 by helicopter, in total 66 flights.
- Their flight altitudes were about 300 m above ground, and the air dose rate at the ground surface is the averaged value of air dose rates in a roughly about 600 m diameter circle (varies by flight altitude) below the aircraft.
- The width of the flight path of the aircraft was 1.8 km in the surveys last fiscal year. In the seventh airborne monitoring, the width of flight paths are 0.6 km for the evacuation area, 0.9 km in the area where the sixth airborne monitoring survey result was 0.2 µSv/h or above, and 1.8 km in the remaining area.
- In order to prepare air dose rates, we first obtained the relation between counting rates (cps) measured in the air ( 150 - 900 m) above the test line established at each of the monitoring areas and air dose rates (µSv/h) at the height of 1 m above the ground measured around the test line using NaI scintillators, and then calculated air dose rates at the height of 1 m above the ground using counting rates measured in the air above the respective measuring points. The data include air dose rates by natural radionuclides.
- The values have been decay-compensated to the value for September 28, 2013, which is the final day in which the seventh airborne monitoring survey was conducted. Decay-compensated air dose rates were obtained by subtracting the average air dose rates due to natural radionuclides from the measured values and then considering physical attenuation of Cs-134 and Cs-137 from the measurement time up to a certain point in time (September 28, 2013) (For detailed information about the method, see Attachment 9, Results of Airborne Monitoring Survey by MEXT in the Kyushu Region and Okinawa Prefecture, May 11, 2012).
- The data consists of air dose rates at the median points of the Quarter Grid Squares (approximately 250 m x 250 m) defined by JIS X 0410. See the Ministry of Internal Affairs and Communications Statistics Bureau website for "Grid Square Statistics".
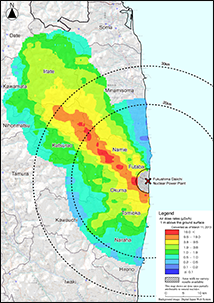
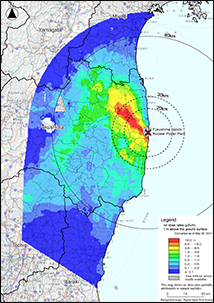
Air Dose Rate Results of the Airborne Monitoring Survey in the Areas to which Evacuation Orders Have Been Issued ( Decay correction: March 11, 2013 )
- This data was created based on the measurement results from the airborne monitoring survey conducted by MEXT in the restricted areas and areas to which evacuation orders have been issued.
- This published data was prepared based on the results obtained from March 4 to March 11, 2013 by one helicopter, in a total 13 flights.
- Their flight altitudes were from about 300 m above ground, and the air dose rate at the ground surface is the averaged value of air dose rates in a roughly about 600 m diameter circle (varies by flight altitude) below the aircraft.
- The width of the track is around 1.85 km.
- Regarding air dose rates, we established one test line and hovering point within the target area of this monitoring survey, and first ascertained trends at each altitude in counting rates (cps) measured in the air above the test line (150 to 1,500 m) (altitude correction function), and then based on the counting rate at an altitude of 300 m above the hovering point and air dose rates (µSv/h) at a height of 1 m above the ground measured around the hovering point using NaI scintillators, obtained the conversion factor between counting rates and air dose rates at a height of 1 m above the ground (cps/(µSv/h)). Air dose rates 1 m above the ground were calculated by converting counting rates measured in the air above each monitoring point, using said altitude correction function and the conversion factor. The data include air dose rates by natural radionuclides.
- The values have been decay-compensated to the value for March 11, 2013, which is the final day in which the airborne monitoring survey was conducted in the restricted areas and areas to which evacuation orders have been issued. Decay-compensated air dose rates were obtained by subtracting the average air dose rates due to natural radionuclides from the measured values and then considering physical attenuation of Cs-134 and Cs-137 from the measurement time up to a certain point in time (March 11, 2013) (For the detail of method, see Attachment 9, Results of Airborne Monitoring Survey by MEXT in the Kyushu Region and Okinawa Prefecture, May 11, 2012).
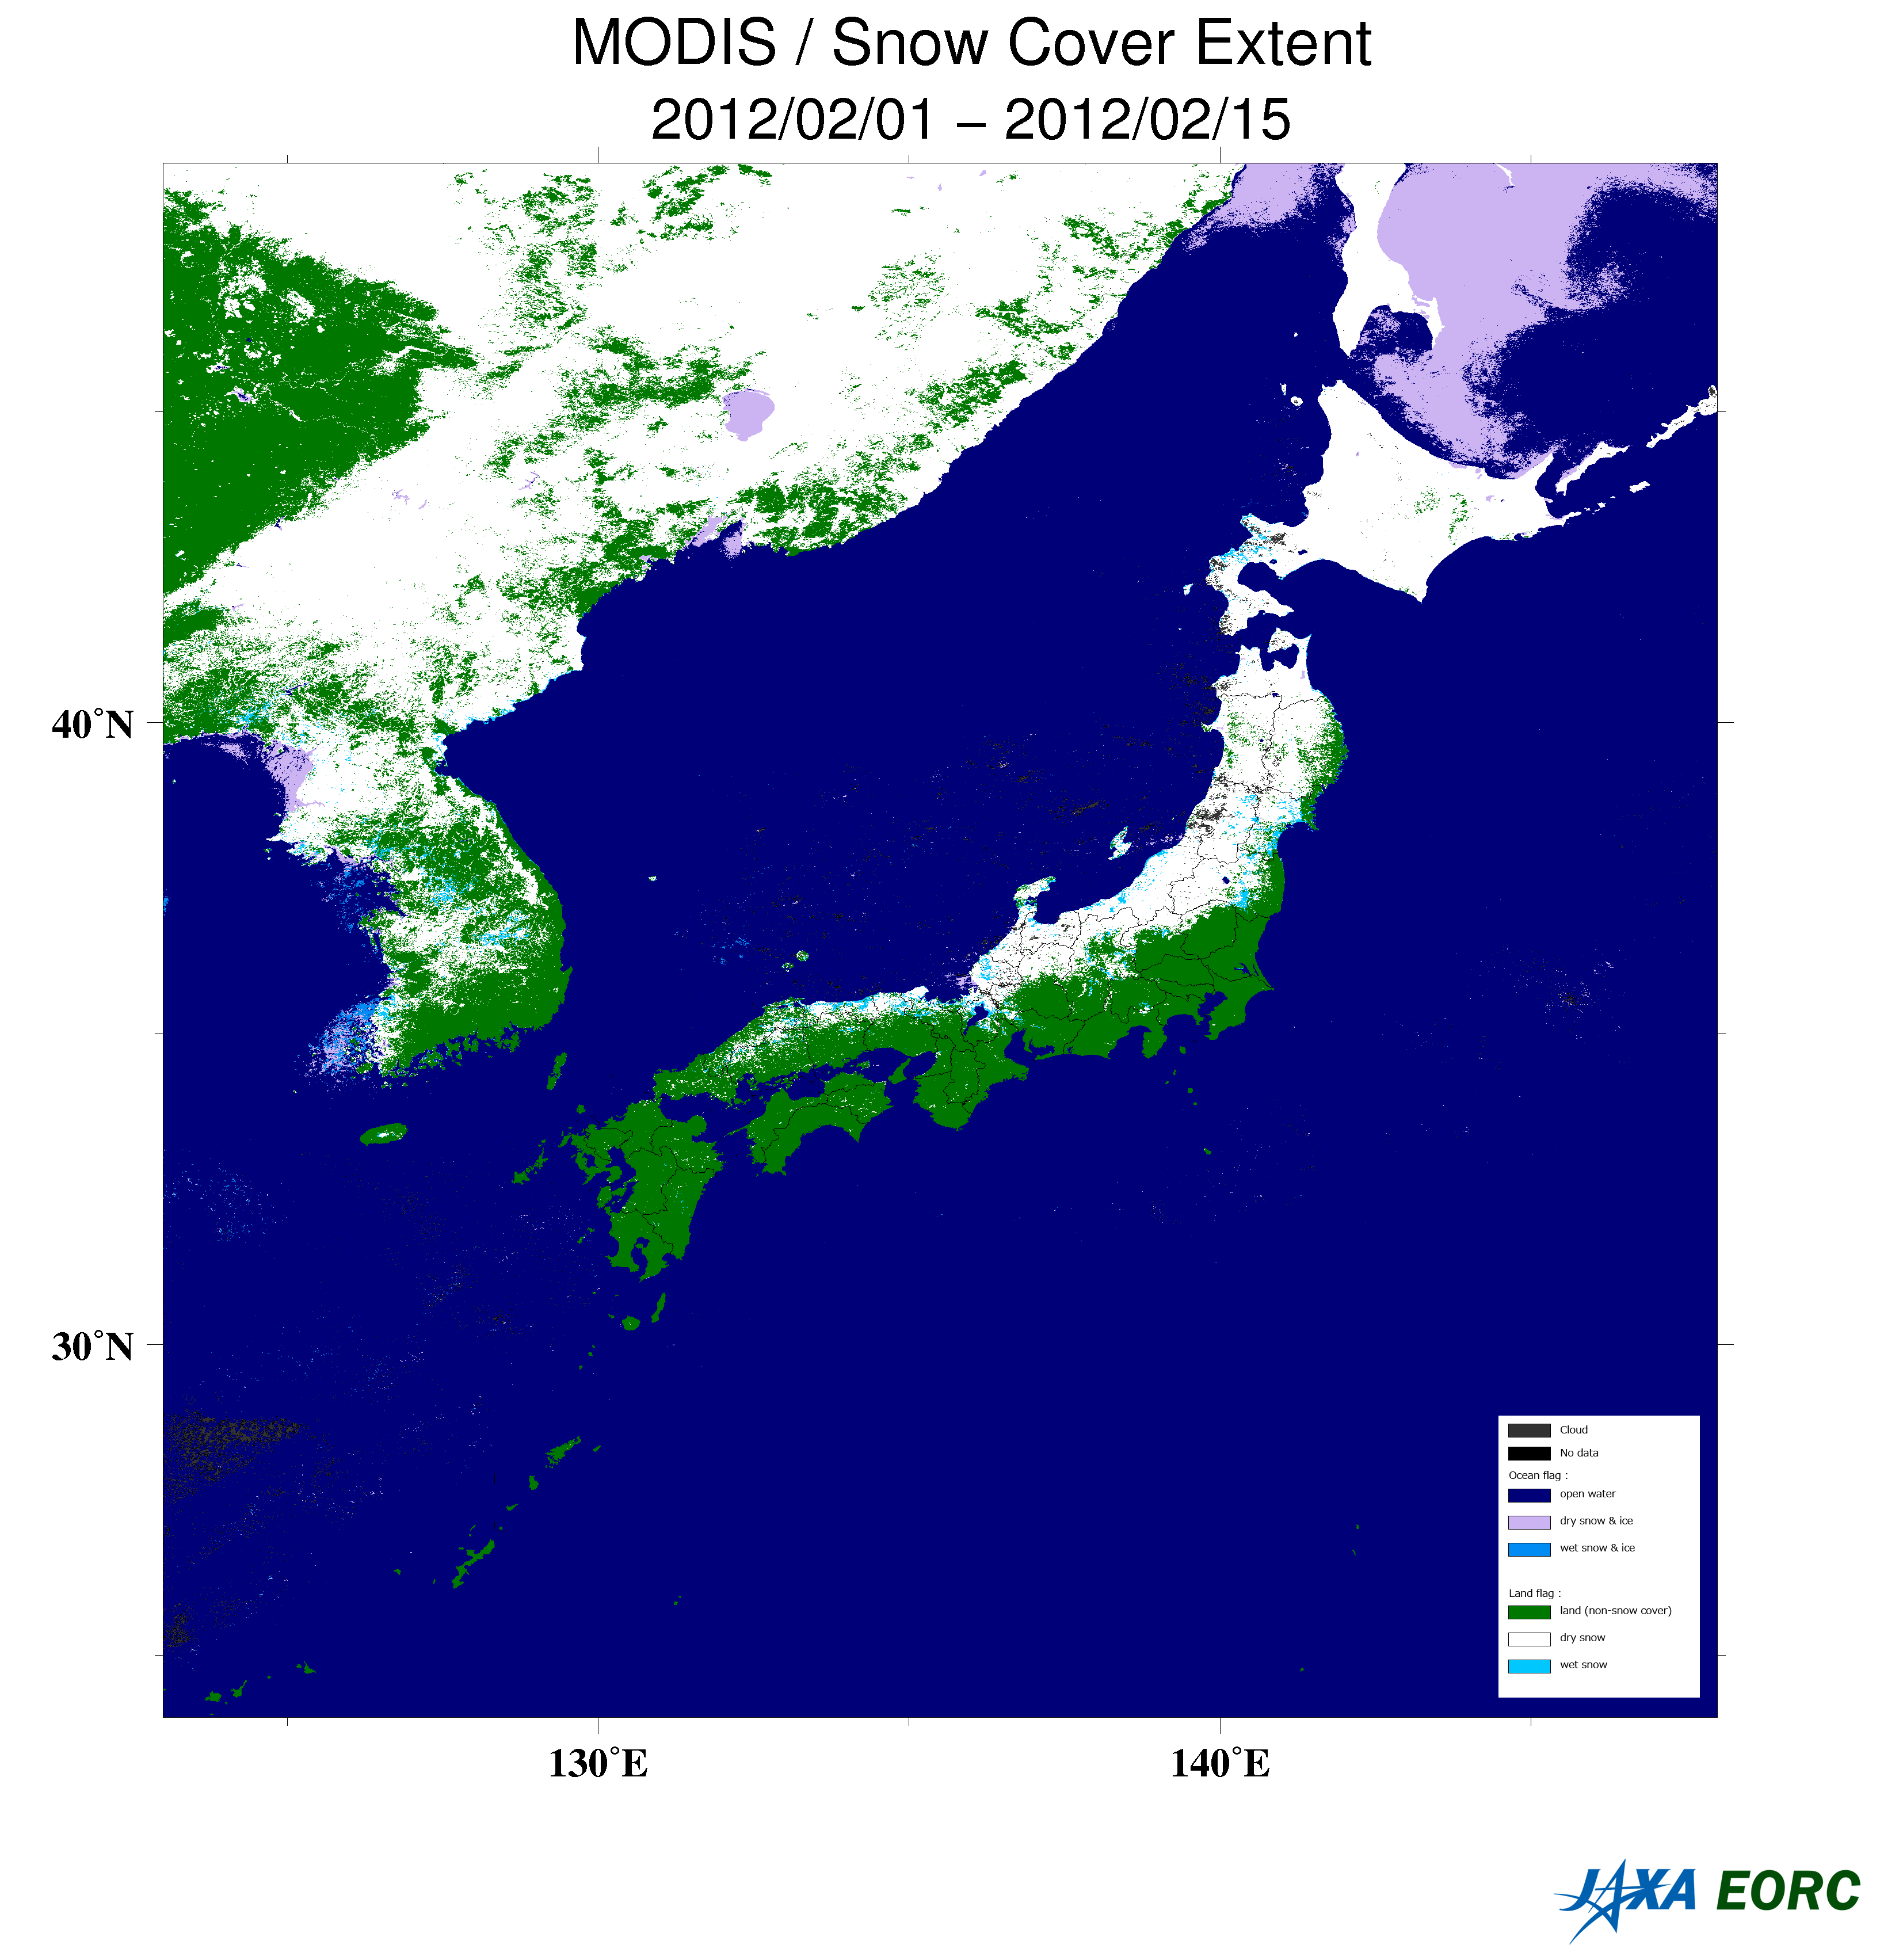
- There was snow coverage in some part of the targeted areas of this monitoring. It has been expected that the air dose rate measurements are apt to be lower due to the effect of snow coverage. Therefore, in order to distinguish areas covered by snow, such areas are indicated as data. When identifying areas covered by snow, we used data obtained by NASA's earth observation satellites, Terra and Aqua*2, which are available on JASMES*1 released by the Japan Aerospace Exploration Agency.
- The data consists of air dose rates at the median points of the Quarter Grid Squares (approximately 250 m x 250 m) defined by JIS X 0410. See the Ministry of Internal Affairs and Communications Statistics Bureau website for "Grid Square Statistics".
*1: JAXA Satellite Monitoring for Environmental Studies
*2:We used the data of snow coverage around Japan, which were observed by the Moderate Resolution Imaging Spectroradiometer (MODIS) installed on NASA’s earth observation satellites, Terra and Aqua, and were analyzed by the Japan Aerospace Exploration Agency (JAXA) using its original processing algorithm. JAXA has been planning the Global Change Observation Mission (GCOM) to observe the Earth’s environment as a whole, including the atmosphere, ocean, land, snow and ice, from space on a long-term basis (10 to 15 years), thereby monitoring hydrologic circulation and climate change and figuring out the mechanisms thereof. Said data have been collected and processed for the purpose of assessing the analytical algorithm for optical sensors used in the Global Change Observation Satellite (GCOM-C). As they are 500 m-grid data, snow coverage over 5 cm with an even surface can be indicated correctly, but it is sometimes difficult to accurately identify snow coverage of a shallower depth or with an uneven surface.
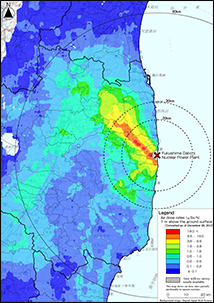
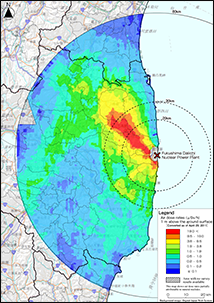
Air Dose Rate Results of the Sixth Airborne Monitoring Survey and Airborne Monitoring Survey Outside 80 km from the Fukushima Dai-ichi NPP ( Decay correction: December 28, 2012 )
- This data was created based on the measurement results of the sixth airborne monitoring survey and the airborne monitoring survey outside the 80 km range from the Fukushima Dai-ichi NPP by MEXT (second time in FY2012).
- This published data was prepared based on the results obtained from October 31 to November 16, 2012 by a helicopter, in a total 37 flights for the sixth airborne monitoring and from October 31 to December 28, 2012 by two helicopters, in a total 87 flights for the airborne monitoring outside the 80 km range from the Fukushima Dai-ichi NPP (second time in FY2012).
- Their flight altitudes were from about 300 m above ground, and the air dose rate at the ground surface is the averaged value of air dose rates in a roughly about 600 m diameter circle (varies by flight altitude) below the aircraft.
- The width of the flight path of the aircraft is around 1.85 km in the sixth airborne monitoring, and around 3 km for the airborne monitoring outside 80 km from the Fukushima Dai-ichi NPP (second time in FY2012).
- In order to prepare air dose rates, we first obtained the relation between counting rates (cps) measured in the air above the test line established at each of the monitoring areas and air dose rates (µSv/h) at the height of 1 m above the ground measured around the test line using NaI scintillators, and then calculated air dose rates at the height of 1 m above the ground using counting rates measured in the air above the respective measuring points. The data include air dose rates by natural radionuclides.
- The values have been decay-compensated to the value for December 28, 2012, which is the final day in which the airborne monitoring survey outside the 80 km range from the Fukushima Dai-ichi NPP (second time in FY2012) was conducted. Decay-compensated air dose rates were obtained by subtracting the average air dose rates due to natural radionuclides from the measured values and then considering physical attenuation of Cs-134 and Cs-137 from the measurement time up to a certain point in time (December 28, 2012) (For the detail of method, see Attachment 9, Results of Airborne Monitoring Survey by MEXT in the Kyushu Region and Okinawa Prefecture, May 11, 2012).
- Snowfall was confirmed in certain regions (western Fukushima Prefecture, Gunma Prefecture, eastern Yamagata Prefecture, etc.) within the range where the monitoring outside 80 km from the Fukushima Dai-ichi NPP (second time in FY2012) was conducted. With regard to these regions, it has been expected that the air dose rate measurements are apt to be lower due to the effect of snow coverage. Therefore, in order to distinguish areas covered by snow, such areas are indicated as data. When identifying areas covered by snow, we used data obtained by NASA’s earth observation satellites, Terra and Aqua*2, which are available on JASMES*1 released by the Japan Aerospace Exploration Agency.
- The data consists of air dose rates at the median points of the Quarter Grid Squares (approximately 250 m x 250 m) defined by JIS X 0410. See the Ministry of Internal Affairs and Communications Statistics Bureau website for "Grid Square Statistics".
*1: JAXA Satellite Monitoring for Environmental Studies
*2:We used the data of snow coverage around Japan, which were observed by the Moderate Resolution Imaging Spectroradiometer (MODIS) installed on NASA’s earth observation satellites, Terra and Aqua, and were analyzed by the Japan Aerospace Exploration Agency (JAXA) using its original processing algorithm. JAXA has been planning the Global Change Observation Mission (GCOM) to observe the Earth’s environment as a whole, including the atmosphere, ocean, land, snow and ice, from space on a long-term basis (10 to 15 years), thereby monitoring hydrologic circulation and climate change and figuring out the mechanisms thereof. Said data have been collected and processed for the purpose of assessing the analytical algorithm for optical sensors used in the Global Change Observation Satellite (GCOM-C). As they are 500 m-grid data, snow coverage over 5 cm with an even surface can be indicated correctly, but it is sometimes difficult to accurately identify snow coverage of a shallower depth or with an uneven surface.
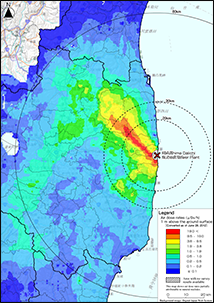
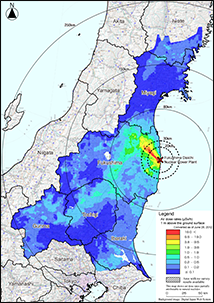
Air Dose Rate Results of the Fifth Airborne Monitoring Survey and Airborne Monitoring Survey Outside 80 km from the Fukushima Dai-ichi NPP ( Decay correction: June 28, 2012 )
- This data was created based on the measurement results of the fifth airborne monitoring survey and the airborne monitoring survey outside the 80 km range from the Fukushima Dai-ichi NPP by MEXT.
- This published data was prepared based on the results obtained from June 22 to June 28, 2012 by two helicopters, in a total 20 flights for the fifth airborne monitoring and from April 2 to May 7, 2012 by two helicopters, in a total 59 flights for the airborne monitoring outside the 80 km range from the Fukushima Dai-ichi NPP.
- Their flight altitudes were from about 300 m above ground, and the air dose rate at the ground surface is the averaged value of air dose rates in a roughly about 600 m diameter circle (varies by flight altitude) below the aircraft.
- The width of the flight path of the aircraft is around 1.85 km in the fifth airborne monitoring, and around 3 km for the airborne monitoring outside 80 km from the Fukushima Dai-ichi NPP.
- In order to prepare air dose rates, we first obtained the relation between counting rates (cps) measured in the air above the test line established at each of the monitoring areas and air dose rates (µSv/h) at the height of 1 m above the ground measured around the test line using NaI scintillators, and then calculated air dose rates at the height of 1 m above the ground using counting rates measured in the air above the respective measuring points. The data include air dose rates by natural radionuclides.
- The values have been decay-compensated to the value for June 28, 2012, which is the final day in which the fifth airborne monitoring survey was conducted. Decay-compensated air dose rates were obtained by subtracting the average air dose rates due to natural radionuclides from the measured values and then considering physical attenuation of Cs-134 and Cs-137 from the measurement time up to a certain point in time (June 28, 2012) (For the detail of method, see Attachment 9, Results of Airborne Monitoring Survey by MEXT in the Kyushu Region and Okinawa Prefecture, May 11, 2012).
- Snowfall was confirmed in certain regions (western Fukushima Prefecture, Gunma Prefecture, eastern Yamagata Prefecture, etc.) within the range where the monitoring outside 80 km from the Fukushima Dai-ichi NPP was conducted. With regard to these regions, it has been expected that the air dose rate measurements are apt to be lower due to the effect of snow coverage. Therefore, in order to distinguish areas covered by snow, such areas are indicated as data. When identifying areas covered by snow, we used data obtained by NASA’s earth observation satellites, Terra and Aqua*2, which are available on JASMES*1 released by the Japan Aerospace Exploration Agency.
- The data consists of air dose rates at the median points of the Quarter Grid Squares (approximately 250 m x 250 m) defined by JIS X 0410. See the Ministry of Internal Affairs and Communications Statistics Bureau website for "Grid Square Statistics".
*1: JAXA Satellite Monitoring for Environmental Studies
*2:We used the data of snow coverage around Japan, which were observed by the Moderate Resolution Imaging Spectroradiometer (MODIS) installed on NASA’s earth observation satellites, Terra and Aqua, and were analyzed by the Japan Aerospace Exploration Agency (JAXA) using its original processing algorithm. JAXA has been planning the Global Change Observation Mission (GCOM) to observe the Earth’s environment as a whole, including the atmosphere, ocean, land, snow and ice, from space on a long-term basis (10 to 15 years), thereby monitoring hydrologic circulation and climate change and figuring out the mechanisms thereof. Said data have been collected and processed for the purpose of assessing the analytical algorithm for optical sensors used in the Global Change Observation Satellite (GCOM-C). As they are 500 m-grid data, snow coverage over 5 cm with an even surface can be indicated correctly, but it is sometimes difficult to accurately identify snow coverage of a shallower depth or with an uneven surface.
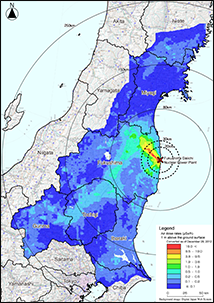
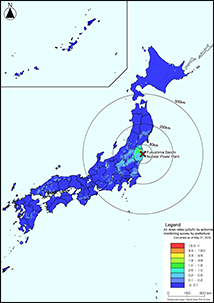
Air Dose Rate Results of the Airborne Monitoring Survey by Prefecture ( Decay correction: May 31, 2012 )
- This data was created based on the measurement results of the airborne monitoring surveys for 47 Prefectures by MEXT.
- This published data was prepared based on the results obtained in the measurement periods shown in the table below.
- As flights are difficult in mountainous areas over 2,000 m in height, there were no data available for such areas.
- Their flight altitudes were from 150 to 300 m above ground (varies by Prefecture). The air dose rate at the ground surface is the averaged value of air dose rates in a roughly 300 m to 600 m diameter circle (varies by flight altitude) below the aircraft.
- The width of the flight paths of the aircraft are around 1.85 km within the 80 km area, 5 km within the 80-100 km (120 km south side) area, 3 km for eastern Japan, 5 km for western Japan and Hokkaido.
- In order to prepare air dose rates, we first obtained the relation between counting rates (cps) measured in the air above the test line established at each of the monitoring areas (one per Prefecture where air dose rate fluctuation was small) and air dose rates (µSv/h) at the height of 1 m above the ground measured around the test line using NaI scintillators, and then calculated air dose rates at the height of 1 m above the ground using counting rates measured in the air above the respective measuring points. The data include air dose rates by natural radionuclides.
- Regarding air borne monitoring throughout Japan, results have been announced by Prefecture or blocks. Due to the development of analysis methods including radioactive cesium deposition considering the influence of natural radionuclides, the past announced results have been subjected to be revised. In such circumstances, this database stores data throughout Japan using the latest analysis methods and decay-compensation as of May 31, 2012 which is the final day of the air borne monitoring of Hokkaido where the latest monitoring area throughout Japan.Deposition densities of cesium 134 and cesium 137 were obtained considering physical attenuation of cesium 134 and cesium 137 from the measurement time up to a certain point in time (May 31, 2012).
- ① Regarding Western Japan and Hokkaido, air dose rates were obtained by subtracting the average air dose rates due to natural radionuclides from the measured values using "Method to Assess Influences of Natural Radionuclides in Airborne Monitoring over the Western Part of Japan" (For the detail of method, see Attachment 9, Results of Airborne Monitoring Survey by MEXT in the Kyushu Region and Okinawa Prefecture, May 11, 2012)
- ② With regard to the areas in the eastern part of Japan where the monitoring surveys were conducted using the same combination of helicopter and measuring equipment used in the airborne monitoring survey in the western part of Japan (the areas targeted in the Second Airborne Monitoring (within an 80 to 100 km-range (or 120 km-range on the southern part) from Fukushima Dai-ichi NPP), and part of the areas targeted in the Fourth Airborne Monitoring (within a 40 to 80 km-range from Fukushima Dai-ichi NPP), as well as Aichi, Aomori, Akita, Ishikawa, Iwate, Kanagawa, Gifu, Saitama, Shizuoka, Chiba, Tokyo, Toyama, Nagano, Niigata, Fukui and Yamanashi Prefectures, and the western part of Fukushima Prefecture), the method ① is applicable. Therefore, using this method, the measurement results of the monitoring for the aforementioned area were revised by subtracting the air dose rates due to natural radionuclides.
- ③ With regard to areas in the eastern part of Japan where the airborne monitoring surveys were conducted using disaster-prevention helicopters owned by respective Prefectures, (within a 40 km-range of the Fourth Airborne Monitoring, in the northern part of Miyagi Prefecture out of a 100 km range of Fukushima Dai-ichi NPP, in the southern part of Tochigi Prefecture out of a 120 km range of Fukushima Dai-ichi NPP, outside of an 120 km range of the Fukushima Dai-ichi NPP in Ibaraki Prefecture, and outside of an around 100 km range of the Fukushima Dai-ichi NPP in Yamagata Prefecture and Gunma Prefecture), the combination of helicopters and measuring equipment used was not the same as that used in the airborne monitoring survey in the western part of Japan. Since the method ① is not applicable, the measurement results of the monitoring for the aforementioned area were revised by subtracting the air dose rates due to natural radionuclides using the average value for eastern Japan before the Fukushima dai-ichi NPP accident (0.0687 µSv/h).
- The data consists of air dose rates at the median points of the Quarter Grid Squares (approximately 250 m x 250 m) defined by JIS X 0410. See the Ministry of Internal Affairs and Communications Statistics Bureau website for "Grid Square Statistics".
∙Measurement Period of Each Prefecture
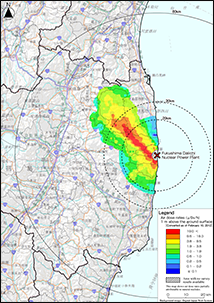
Air Dose Rate Results of the Airborne Monitoring Survey in the Restricted Areas and Planned Evacuation Zones ( Decay correction: February 10, 2012 )
- This data was created based on the measurement results through the airborne monitoring survey conducted in the restricted areas and deliberate evacuation areas by MEXT.
- This published data was prepared based on the results obtained from February 6 to February 10, 2012 by one helicopter, in a total 7 flights.
- Their flight altitudes were from about 300 m above ground, and the air dose rate at the ground surface is the averaged value of air dose rates in a roughly about 600 m diameter circle (varies by flight altitude) below the aircraft.
- The width of the track is around 1.8 km.
- Regarding air dose rates, we established one test line within the target area of this monitoring survey, and first ascertaining trends at each altitude in counting rates (cps) measured in the air on the test line (150 to 900 m) (altitude correction function), and then based on the counting rate at a certain altitude above the test line and air dose rates (µSv/h) at a height of 1 m above the ground measured around the test line using NaI scintillators, obtaining the conversion factor between counting rates and air dose rates at a height of 1 m above the ground (cps/(µSv/h)). Air dose rates 1 m above the ground were calculated by converting counting rates measured in the air above each monitoring point, using said altitude correction function and the conversion factor. The data include air dose rates by natural radionuclides
- The decay-compensated values as of the final day of the monitoring (February 10, 2012) were used. Decay-compensated air dose rates were obtained by subtracting the average air dose rates due to natural radionuclides throughout all of East Japan (0.0687 µSv/h) from the measured values and then considering physical attenuation of Cs-134 and Cs-137 from the measurement time up to a certain point in time (February 10, 2012) .
- There was snow coverage in some part of the targeted areas of this monitoring. Past monitoring results by MEXT have shown that air dose rates are apt to be lower at points covered by snow, with gamma rays being shielded, and the same tendency is expected to be observed. Therefore, in order to distinguish areas covered by snow (where the measurement results of air dose rates are supposed to show a lower deposition of radioactive cesium), such areas are indicated in data. When identifying areas covered by snow, we used data obtained by NASA’s earth observation satellites, Terra and Aqua,*2 which are available on the JASMES *1 released by the Japan Aerospace Exploration Agency.
- The data consists of air dose rates at the median points of the Quarter Grid Squares (approximately 250 m x 250 m) defined by JIS X 0410. See the Ministry of Internal Affairs and Communications Statistics Bureau website for "Grid Square Statistics".
*1: JAXA Satellite Monitoring for Environmental Studies
*2: We used the data of snow coverage around Japan, which were observed by the Moderate Resolution Imaging Spectroradiometer (MODIS) installed on NASA’s earth observation satellites, Terra and Aqua, and were analyzed by the Japan Aerospace Exploration Agency (JAXA) using its original processing algorithm. JAXA has been planning the Global Change Observation Mission (GCOM) to observe the Earth’s environment as a whole, including the atmosphere, ocean, land, snow and ice, from space on a long-term basis (10 to 15 years), thereby monitoring hydrologic circulation and climate change and figuring out the mechanisms thereof. Said data have been collected and processed for the purpose of assessing the analytical algorithm for optical sensors used in the Global Change Observation Satellite (GCOM-C). As they are 500 m-grid data, snow coverage over 5 cm with an even surface can be indicated correctly, but it is sometimes difficult to accurately identify snow coverage of a shallower depth or with an uneven surface.
Air Dose Rate Results of the Fourth Airborne Monitoring Survey ( Decay correction: November 5, 2011 )
- This data was created based on the measurement results of the fourth airborne monitoring survey by MEXT.
- This published data was prepared based on results obtained from October 22 to November 5, 2011 by two helicopters, in a total 27 flights.
- Their flight altitudes were from 150 to 300 m above ground. The air dose rate at the ground surface is the averaged value of air dose rates in a roughly 300 m to 600 m diameter circle (varies by flight altitude) below the aircraft.
- The width of the track of airborne is around 1.8 km. However, comparing the ratios of measurement results of the third airborne monitoring and the first airborne monitoring, it was confirmed that there were some monitoring points where air dose rates were larger through interpolation due to differences in the flight method. Therefore, as in the first airborne monitoring, we additionally conducted monitoring at 300 m intervals in each of the coastal areas at the southern and northern parts of the Fukushima Dai-ichi NPP.
- Regarding air dose rates, we established one test line within the target area of this monitoring survey, and first ascertaining trends at each altitude in counting rates (cps) measured in the air on the test line (150 to 900 m) (altitude correction function), and then based on the counting rate at a certain altitude above the test line and air dose rates (µSv/h) at a height of 1 m above the ground measured around the test line using NaI scintillators, obtaining the conversion factor between counting rates and air dose rates at a height of 1 m above the ground (cps/(µSv/h)). Air dose rates 1 m above the ground were calculated by converting counting rates measured in the air above each monitoring point, using said altitude correction function and the conversion factor. The data include air dose rates by natural radionuclides
- The decay-compensated values as of the final day of the monitoring (November 5, 2011) were used. Decay-compensated air dose rates were obtained by subtracting the average air dose rates due to natural radionuclides throughout all of East Japan (0.0687 µSv/h) from the measured values and then considering physical attenuation of Cs-134 and Cs-137 from the measurement time up to a certain point in time.
- The data consists of air dose rates at the median points of the Quarter Grid Squares (approximately 250 m x 250 m) defined by JIS X 0410. See the Ministry of Internal Affairs and Communications Statistics Bureau website for "Grid Square Statistics".
Air Dose Rate Results of the Third Airborne Monitoring Survey ( Decay correction: July 2, 2011 )
- This data was created based on the measurement results of the third airborne monitoring survey by MEXT.
- This published data was prepared based on results obtained from May 31 to July 2, 2011 by two helicopters, in a total 29 flights.
- Their flight altitudes were from 150 to 300 m above ground. The air dose rate at the ground surface is the averaged value of air dose rates in a roughly 300 m to 600 m diameter circle (varies by flight altitude) below the aircraft.
- The width of the flight path of the aircraft is around 2 km.
- Regarding air dose rates, we established one test line within the target area of this monitoring survey, and first ascertaining trends at each altitude in counting rates (cps) measured in the air on the test line (within 40 km area: 200 to 650 m and within 40-80 km area: 350 to 600 m) (altitude correction function), and then based on the counting rate at a certain altitude above the test line and air dose rates (µSv/h) at a height of 1 m above the ground measured around the test line using NaI scintillators, obtaining the conversion factor between counting rates and air dose rates at a height of 1 m above the ground (cps/(µSv/h)). Air dose rates 1 m above the ground were calculated by converting counting rates measured in the air above each monitoring point, using said altitude correction function and the conversion factor. The data include air dose rates by natural radionuclides
- The decay-compensated values as of the final day of the monitoring (July 2, 2011) were used. Decay-compensated air dose rates were obtained by subtracting the average air dose rates due to natural radionuclides throughout all of East Japan (0.0687 µSv/h) from the measured values and then considering physical attenuation of Cs-134 and Cs-137 from the measurement time up to a certain point in time.
- The data consists of air dose rates at the median points of the Quarter Grid Squares (approximately 250 m x 250 m) defined by JIS X 0410. See the Ministry of Internal Affairs and Communications Statistics Bureau website for "Grid Square Statistics".
Air Dose Rate Results of the Second Airborne Monitoring Survey ( Decay correction: May 26, 2011 )
- This data was created based on the measurement results of the second airborne monitoring survey by MEXT.
- This published data was prepared based on results obtained from May 18 to 26, 2011 by a helicopter, in a total 13 flights.
- Their flight altitudes were from 150 to 300 m above ground. The air dose rate at the ground surface is the averaged value of air dose rates in a roughly 300 m to 600 m diameter circle (varies by flight altitude) below the aircraft.
- The width of the track is around 3-5 km.
- Regarding air dose rates, we established one test line within the target area of this monitoring survey, and first ascertaining trends at each altitude in counting rates (cps) measured in the air on the test line (150 to 600 m) (altitude correction function), and then based on the counting rate at a certain altitude above the test line and air dose rates (µSv/h) at a height of 1 m above the ground measured around the test line using NaI scintillators, obtaining the conversion factor between counting rates and air dose rates at a height of 1 m above the ground (cps/(µSv/h)). Air dose rates 1 m above the ground were calculated by converting counting rates measured in the air above each monitoring point, using said altitude correction function and the conversion factor.
- The decay-compensated values as of the final day of the monitoring (May 26, 2011) were used. Decay-compensated air dose rates were obtained by subtracting the average air dose rates due to natural radionuclides throughout all of East Japan (0.0687 µSv/h) from the measured values and then considering physical attenuation of Cs-134 and Cs-137 from the measurement time up to a certain point in time.
- The decay-compensated values as of May 26 were used for the data within 80 km from the Fukushima Dai-ichi NPP.
- The data consists of air dose rates at the median points of the Quarter Grid Squares (approximately 250 m x 250 m) defined by JIS X 0410. See the Ministry of Internal Affairs and Communications Statistics Bureau website for "Grid Square Statistics".
Air Dose Rate Results of the First Airborne Monitoring Survey ( Decay correction: April 29, 2011 )
- This data was created based on the measurement results of the first airborne monitoring survey by MEXT.
- This published data was prepared based on results obtained from April 6 to 29, 2011 by a small airplane and two helicopters, in a total 42 flights.
- Their flight altitudes were from 150 to 700 m above ground. The air dose rate at the ground surface is the averaged value of air dose rates in a roughly 300 m to 1,500 m diameter circle (varies by flight altitude) below the aircraft.
- Regarding air dose rates, we established one test line within the target area of this monitoring survey, and first ascertaining trends at each altitude in counting rates (cps) measured in the air on the test line (altitude correction function), and then based on the counting rate at a certain altitude above the test line and air dose rates (µSv/h) at a height of 1 m above the ground measured around the test line using NaI scintillators, obtaining the conversion factor between counting rates and air dose rates at a height of 1 m above the ground (cps/(µSv/h)). Air dose rates 1 m above the ground were calculated by converting counting rates measured in the air above each monitoring point, using said altitude correction function and the conversion factor.
- The eastern part of Inawashiro Town is a mountainous area, making low altitude flights difficult, so there are no measurement results there.
- Airborne monitoring just above the Fukushima Dai-ichi NPP has to be consist of the measurement of the air dose rate directly from the power plant, so such monitoring has not been done.
- The decay-compensated values as of the final day of the monitoring (April 29, 2011) were used. Decay-compensated air dose rates were obtained by subtracting the average air dose rates due to natural radionuclides throughout all of East Japan (0.0687 µSv/h) from the measured values and then considering physical attenuation of Cs-134 and Cs-137 from the measurement time up to a certain point in time.
- The data consists of air dose rates at the median points of the Quarter Grid Squares (approximately 250 m x 250 m) defined by JIS X 0410. See the Ministry of Internal Affairs and Communications Statistics Bureau website for "Grid Square Statistics".
Air Dose Rate Measurement Results at the Height of 1 m above the Ground in Fukushima Prefecture and the Neighboring Prefectures (As of November 16, 2017 (80th Month After the Accident)) ( Decay correction: November 16, 2017 )
KML
CSV
Air Dose Rate Measurement Results at the Height of 1 m above the Ground in Fukushima Prefecture and the Neighboring Prefectures (As of November 18, 2016 (68th Month After the Accident)) ( Decay correction: November 18, 2016 )
KML
CSV
Air Dose Rate Measurement Results at the Height of 1 m above the Ground in Fukushima Prefecture and the Neighboring Prefectures (As of November 4, 2015 (56th Month After the Accident)) ( Decay correction: November 4, 2015 )
KML
CSV
Air Dose Rate Measurement Results at the Height of 1 m above the Ground in Fukushima Prefecture and the Neighboring Prefectures (As of November 7, 2014 (44th Month After the Accident)) ( Decay correction: November 7, 2014 )
KML
CSV
Air Dose Rate Measurement Results at the Height of 1 m above the Ground in Fukushima Prefecture and the Neighboring Prefectures (As of November 19, 2013 (32nd Month After the Accident)) ( Decay correction: November 19, 2013 )
KML
CSV
Air Dose Rate Results of the Seventh Airborne Monitoring Survey ( Decay correction: September 28, 2013 )
Air Dose Rate Results of the Airborne Monitoring Survey in the Areas to which Evacuation Orders Have Been Issued ( Decay correction: March 11, 2013 )
Air Dose Rate Results of the Sixth Airborne Monitoring Survey and Airborne Monitoring Survey Outside 80 km from the Fukushima Dai-ichi NPP ( Decay correction: December 28, 2012 )
KML
CSV
Air Dose Rate Results of the Fifth Airborne Monitoring Survey and Airborne Monitoring Survey Outside 80 km from the Fukushima Dai-ichi NPP ( Decay correction: June 28, 2012 )
KML
CSV
Air Dose Rate Results of the Airborne Monitoring Survey by Prefecture ( Decay correction: May 31, 2012 )
KML
CSV
Air Dose Rate Results of the Airborne Monitoring Survey in the Restricted Areas and Planned Evacuation Zones ( Decay correction: February 10, 2012 )
Air Dose Rate Results of the Fourth Airborne Monitoring Survey ( Decay correction: November 5, 2011 )
Air Dose Rate Results of the Third Airborne Monitoring Survey ( Decay correction: July 2, 2011 )
Air Dose Rate Results of the Second Airborne Monitoring Survey ( Decay correction: May 26, 2011 )
Air Dose Rate Results of the First Airborne Monitoring Survey ( Decay correction: April 29, 2011 )
There is no content for 'Download File'
Air Dose Rate Measurement Results at the Height of 1 m above the Ground in Fukushima Prefecture and the Neighboring Prefectures (As of November 16, 2017 (80th Month After the Accident)) ( Decay correction: November 16, 2017 )
Air Dose Rate Measurement Results at the Height of 1 m above the Ground in Fukushima Prefecture and the Neighboring Prefectures (As of November 18, 2016 (68th Month After the Accident)) ( Decay correction: November 18, 2016 )
Air Dose Rate Measurement Results at the Height of 1 m above the Ground in Fukushima Prefecture and the Neighboring Prefectures (As of November 4, 2015 (56th Month After the Accident)) ( Decay correction: November 4, 2015 )
Air Dose Rate Measurement Results at the Height of 1 m above the Ground in Fukushima Prefecture and the Neighboring Prefectures (As of November 7, 2014 (44th Month After the Accident)) ( Decay correction: November 7, 2014 )
Air Dose Rate Measurement Results at the Height of 1 m above the Ground in Fukushima Prefecture and the Neighboring Prefectures (As of November 19, 2013 (32nd Month After the Accident)) ( Decay correction: November 19, 2013 )
Air Dose Rate Results of the Seventh Airborne Monitoring Survey ( Decay correction: September 28, 2013 )
CSV(Unified format)
Air Dose Rate Results of the Airborne Monitoring Survey in the Areas to which Evacuation Orders Have Been Issued ( Decay correction: March 11, 2013 )
CSV(Unified format)
Air Dose Rate Results of the Sixth Airborne Monitoring Survey and Airborne Monitoring Survey Outside 80 km from the Fukushima Dai-ichi NPP ( Decay correction: December 28, 2012 )
Air Dose Rate Results of the Fifth Airborne Monitoring Survey and Airborne Monitoring Survey Outside 80 km from the Fukushima Dai-ichi NPP ( Decay correction: June 28, 2012 )
Air Dose Rate Results of the Airborne Monitoring Survey by Prefecture ( Decay correction: May 31, 2012 )
CSV(Unified format)
Air Dose Rate Results of the Airborne Monitoring Survey in the Restricted Areas and Planned Evacuation Zones ( Decay correction: February 10, 2012 )
CSV(Unified format)
Air Dose Rate Results of the Fourth Airborne Monitoring Survey ( Decay correction: November 5, 2011 )
CSV(Unified format)
Air Dose Rate Results of the Third Airborne Monitoring Survey ( Decay correction: July 2, 2011 )
CSV(Unified format)
Air Dose Rate Results of the Second Airborne Monitoring Survey ( Decay correction: May 26, 2011 )
Air Dose Rate Results of the First Airborne Monitoring Survey ( Decay correction: April 29, 2011 )
CSV(Unified format)
- Airborne Monitoring Survey in Fukushima Prefecture and the Neighboring Prefectures
- Airborne Monitoring Over A Wide Area[The Ministry of Education, Culture, Sports, Science and Technology]
- Snow-covered area (February 1 to February 15, 2012) )JASMES(JAXA)
- Results of Airborne Monitoring by the MEXT and the U.S. Department of Energy