- JAEA has carried out “the project on the Long-term Assessment of Transport of Radioactive Contaminant in the Environment of Fukushima (F-TRACE project)” since the end of 2012. Radioactive caesium has been distributed by the fall out by Fukushima Dai-ichi Nuclear Power Plant (1F-NPP) accident, and forests in mountain areas have large amount of inventory of radioactive caesium and cover relatively large part of contaminated area of Fukushima. In this project, the transport behavior of radioactive caesium from the forests to biosphere and sea is evaluated by computer simulation based on the results of field observation and laboratory experiments. The results are used to predict evolution of effective dose of the residents in the affected area due to the transport, specify the dominant pass way of caesium, and propose effective methodology to constrain the transport along the pass way.
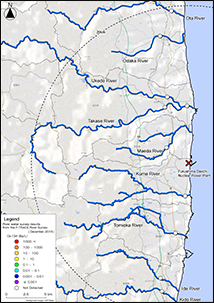
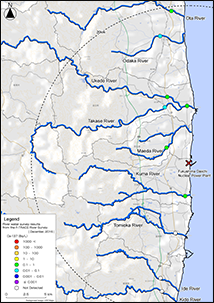
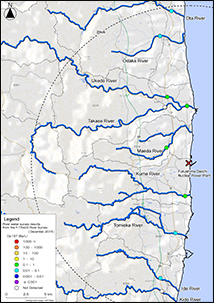
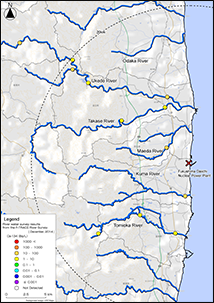
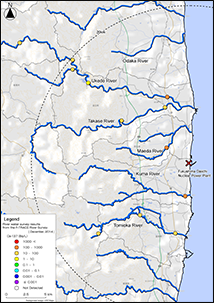
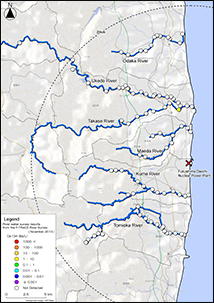
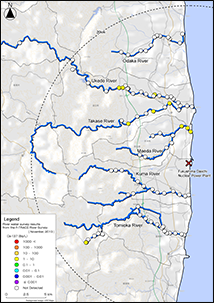
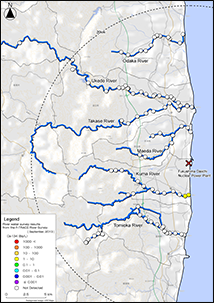
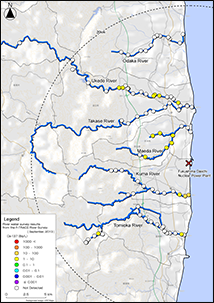
- The field investigations were conducted focusing on the river transport including forest, rivers, dams, reservoirs, and estuary. The data displayed here were based on the river survey results of river water.
- Five rivers at Hamadori area including Ukedo river (with Takase river), Odaka river, Maeda river, Kuma river, and Tomioka river (with Oginosawa river) were surveyed. Ten to twenty measurement points were selected in each river from the upstream to the estuary.
- Measurements were conducted from December 2012 to March 2013, September 2013, November 2013, June 2014, and October 2014, April 2015 to December 2016.
- The analytical results indicate radiation quantity (Bq) per unit water (L).
- The total radioactivity concentrations of dissolved state and suspended state were measured.
- Radioactivity concentrations, errors, and detection limits described here were decay corrected values of the sampling date.
- The analysis results were expressed with three significant digits. The detection limit was displayed if the counting value was below three times the counting error.


")