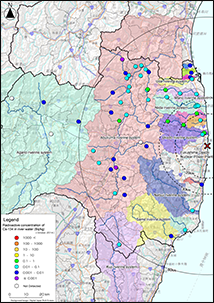
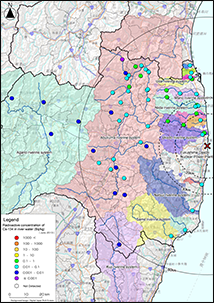
Results of the Nuclide Analysis of River Water Sampled from Rivers in Fukushima Prefecture ( October 2014 )
- In order to confirm the changing trend of the concentrations of radioactive substances in the river water,
- This survey was prepared based on the measurement results of samples collected from October 21, 2014 to October 23, Heisei 20.
- The analysis results show radiation (Bq) per unit weight (kg).
- In order to confirm the changing trend of the concentrations of radioactive substances, we took the river water from the same locations of the third survey (57 locations). When selecting locations to collect river samples (river water, bottom sediment, and suspended sediment), it was taken into consideration as the selection criteria that 1) the location should have a relatively high accumulated radioactive cesium based on the results of the land-based monitoring and airborne monitoring surveys, and 2) the place would be suitable for periodically measuring flow volumes, with a view to following the movement of radioactive substances in detail in the future. Based on these criteria, 57 locations were chosen.
- The analysis results were written to two significant figures. In the case when the count value was equal to or below three times the counting error, the detection limit was stated.
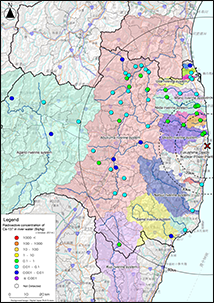
Results of the Nuclide Analysis of River Water Sampled from Rivers in Fukushima Prefecture ( June 2013, November 2013 )
- In order to confirm the changing trend of the concentrations of radioactive substances in the river water,
- In this survey, in order to confirm the changing trend of the concentrations of radioactive substances before and after typhoon season, the samplings were conducted in June 4 to June 6, 2013 as before typhoon season and November 12 to November 14, 2012 as after typhoon season.
- The analysis results show radiation (Bq) per unit weight (kg).
- In order to confirm the changing trend of the concentrations of radioactive substances, we took the river water from the same locations of the third survey (57 locations). When selecting locations to collect river samples (river water, bottom sediment, and suspended sediment), it was taken into consideration as the selection criteria that 1) the location should have a relatively high accumulated radioactive cesium based on the results of the land-based monitoring and airborne monitoring surveys, and 2) the place would be suitable for periodically measuring flow volumes, with a view to following the movement of radioactive substances in detail in the future. Based on these criteria, 57 locations were chosen.
- The radioactivity concentration measurement procedures
- 134Cs and 137Cs
All samples were measured - 90Sr
Because of the long measurement time required, sampling points where detection of these nuclides were expected were chosen (10 points)
- Regarding radioactivity concentration, error and detection limit, 90Sr decay-compensated values from measurement to sampling. Values of other nuclides are at time of measurement.
- The analysis results were written to two significant figures. In the case when the count value was equal to or below three times the counting error, the detection limit was stated.
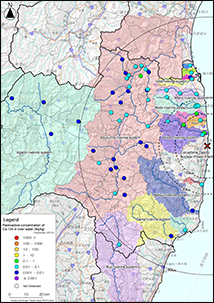
Results of the Nuclide Analysis of River Water Sampled from Rivers in Fukushima Prefecture ( August 2012, November 2012 )
- In order to confirm the changing trend of the concentrations of radioactive substances in the river water, we conducted a subsequent survey to the second survey.
- In this survey, in order to confirm the changing trend of the concentrations of radioactive substances before and after typhoon season, the samplings were conducted in August, 2012 (August 22, 23 and 30) as before typhoon season and November, 2012 (November 27 - 28) as after typhoon season.
- The analysis results show radiation (Bq) per unit weight (kg).
- In order to confirm the changing trend of the concentrations of radioactive substances, we took the river water from the same locations of the first survey and the second survey. When selecting locations to collect river samples (river water, bottom sediment, and suspended sediment), it was taken into consideration as the selection criteria that 1) the location should have a relatively high accumulated radioactive cesium based on the results of the land-based monitoring and airborne monitoring surveys, and 2) the place would be suitable for periodically measuring flow volumes, with a view to following the movement of radioactive substances in detail in the future. Based on these criteria, 50 locations were chosen. In this survey, sampling was also conducted in 7 additional locations in the vicinity of the Fukushima Dai-ichi NPP where sampling had previously not been conducted.
- The radioactivity concentration measurement procedures
- 134Cs, 137Cs and 131I
All samples were measured - 90Sr
Because of the long measurement time required, sampling points where detection of these nuclides were expected were chosen (10 points)
- Regarding radioactivity concentration, error and detection limit, 90Sr decay-compensated values from measurement to sampling. Values of other nuclides are at time of measurement.
- The analysis results were written to two significant figures. In the case when the count value was equal to or below three times the counting error, the detection limit was stated.
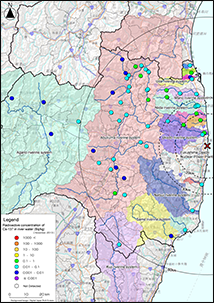
Results of the Nuclide Analysis of River Water Sampled from Rivers in Fukushima Prefecture ( From December 2011 to January 2012 )
- In order to confirm the changing trend of the concentrations of radioactive substances in the river water, we conducted a subsequent survey to the first survey.
- The analysis results show radiation (Bq) per unit weight (kg).
- When selecting locations to collect river samples (river water, bottom sediment, and suspended sediment), it was taken into consideration as the selection criteria that 1) the location should have a relatively high accumulated radioactive cesium based on the results of the land-based monitoring and airborne monitoring surveys, and 2) the place would be suitable for periodically measuring flow volumes, with a view to following the movement of radioactive substances in detail in the future. Based on these criteria, 50 locations were chosen.
- The river water sampling was conducted from December 20, 2011 to December 21, 2011
- The radioactivity concentration measurement procedures
- 134Cs, 137Cs and 131I
All samples were measured - 89Sr and 90Sr
Because of the long measurement time required, sampling points where detection of these nuclides were expected were chosen (10 points)
- Regarding radioactivity concentration, error and detection limit, 89Sr and 90Sr decay-compensated values from measurement to sampling. Values of other nuclides are at time of measurement.
- "ND" in the column "Deposition", "-" in the column "Error", and detection limit value as reference in the column "detection limit": The peak of relevant nuclide was not clearly detected or calculated deposition was equal to or below 0.0.
- Reference value in the column "Deposition" smaller than the detection limit in the column "detection limit": The peak of the relevant nuclide was detected even though the calculated deposition was below detection limit.
Results of the Nuclide Analysis of River Water Sampled from Rivers in Fukushima Prefecture ( From June 2011 to August 2011 )
- The analysis results show radiation (Bq) per unit weight (kg).
- When selecting locations to collect river samples (river water, bottom sediment, and suspended sediment), it was taken into consideration as the selection criteria that 1) the location should have a relatively high accumulated radioactive cesium based on the results of the land-based monitoring and airborne monitoring surveys, and 2) the place would be suitable for periodically measuring flow volumes, with a view to following the movement of radioactive substances in detail in the future. Based on these criteria, 50 locations were chosen.
- In order to confirm the changing trend of the concentrations of radioactive substances in the river water, we conducted samplings twice within the period between June and October.
- The radioactivity concentration measurement procedures
- 134Cs, 137Cs and 131I
All samples were measured - 89Sr,90Sr,238Pu and 239Pu+240Pu
Because of the long measurement time required, sampling points where detection of these nuclides were expected were chosen (10 points)
- Regarding radioactivity concentration, error and detection limit, 89Sr and 90Sr decay-compensated values from measurement to sampling. Values of other nuclides are at time of measurement.
- "ND" in the column "Deposition", "-" in the column "Error", and detection limit value as reference in the column "detection limit": The peak of relevant nuclide was not clearly detected or calculated deposition was equal to or below 0.0.
- Reference value in the column "Deposition" smaller than the detection limit in the column "detection limit": The peak of the relevant nuclide was detected even though the calculated deposition was below detection limit.

/medium.png)
/medium.png)
/medium.png)
/medium.png)
/medium.png)
/medium.png)
/medium.png)
/medium.png)
/medium.png)
/medium.png)
")
")
/large.png "Results of the Nuclide Analysis of River Water Sampled from Rivers in Fukushima Prefecture ( August 2012, November 2012 )")
/large.png "Results of the Nuclide Analysis of River Water Sampled from Rivers in Fukushima Prefecture ( August 2012, November 2012 )")
/large.png "Results of the Nuclide Analysis of River Water Sampled from Rivers in Fukushima Prefecture ( August 2012, November 2012 )")
/large.png "Results of the Nuclide Analysis of River Water Sampled from Rivers in Fukushima Prefecture ( August 2012, November 2012 )")
")
/large.png "Results of the Nuclide Analysis of River Water Sampled from Rivers in Fukushima Prefecture ( From December 2011 to January 2012 )")
")
")
/large.png "Results of the Nuclide Analysis of River Water Sampled from Rivers in Fukushima Prefecture ( From June 2011 to August 2011 )")
/large.png "Results of the Nuclide Analysis of River Water Sampled from Rivers in Fukushima Prefecture ( From June 2011 to August 2011 )")
")
")
/large.png "Results of the Nuclide Analysis of River Water Sampled from Rivers in Fukushima Prefecture ( From June 2011 to August 2011 )")
/large.png "Results of the Nuclide Analysis of River Water Sampled from Rivers in Fukushima Prefecture ( From June 2011 to August 2011 )")
/large.png "Results of the Nuclide Analysis of River Water Sampled from Rivers in Fukushima Prefecture ( From June 2011 to August 2011 )")
/large.png "Results of the Nuclide Analysis of River Water Sampled from Rivers in Fukushima Prefecture ( From June 2011 to August 2011 )")
")