

No images are available for a selected survey
No images are available for a selected survey
No images are available for a selected survey
No images are available for a selected survey
No images are available for a selected survey
No images are available for a selected survey
No images are available for a selected survey
No images are available for a selected survey
No images are available for a selected survey
No images are available for a selected survey
No images are available for a selected survey
No images are available for a selected survey
No images are available for a selected survey
No images are available for a selected survey
No images are available for a selected survey
No images are available for a selected survey
No images are available for a selected survey
No images are available for a selected survey
No images are available for a selected survey
No images are available for a selected survey
No images are available for a selected survey
No images are available for a selected survey
No images are available for a selected survey
No images are available for a selected survey
No images are available for a selected survey
No images are available for a selected survey
")
No images are available for a selected survey
")
No images are available for a selected survey
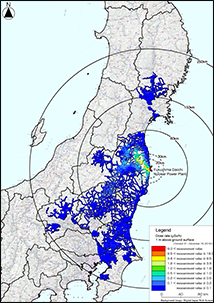
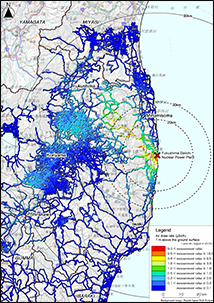
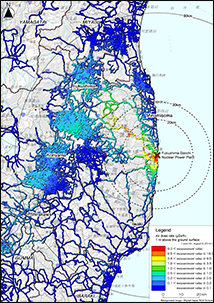
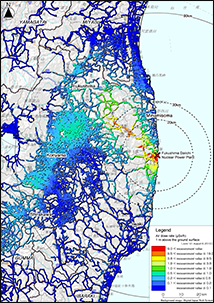
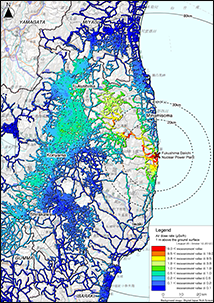
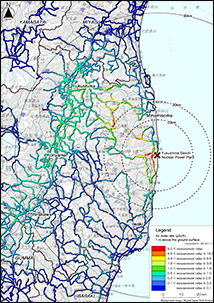
Air Dose Rate Measurement Results from the Thirteenth Vehicle-borne Survey ( From October 31, to December 16, 2016 )
- This data was created based on the results of the vehicle-borne survey conducted by NRA from October 31, to December 16, 2016.
- The purposes of this vehicle survey were (1) to ascertain the tendency and cause of time change of air dose rates by comparing past vehicle survey data and survey meter data at the height of 1 m above ground as well as "walk survey" data, and (2) to contribute to the establishment of radioactive substances distribution prediction model.
- Based on the results of the analysis of nuclides in soil that MEXT had conducted so far, it is assumed that the air dose rates of the survey period are mostly due to radioactive cesium. MEXT evaluated the decrease in the air dose rates caused by the decay of cesium during the survey period and it was around 1%, which was smaller than the errors of measuring instruments. Therefore, NRA decided to use the measurement results as they are, without decay correction as of a certain date.
- Correction factor converting the measured air dose rate inside a car to the air dose rate outside is as follows.
- 1) When the measurement value is 1.0 μSv/h or more: correction coefficient = 1.3 (constant)
- 2) When the measurement value is between 0.01 and 1.0 μSv/h: correction coefficient = 0.06515 × ln (air dose rate inside the vehicle) + 1.3
- 3) When the measurement value is 0.01 μSv/h or less: correction coefficient = 1.0 (constant)
- KURAMA-II system with CsI(Tl) scintillation detectors were used.
- Measured values are the average of the values during the 1.5 seconds required for GPS to read location information.
- In this survey, in order to reduce the statistical variation of the measurement value, the areas where the vehicle was driven were separated into 100 m × 100 m grids, and the air dose rate values of the measurement points that were included in a particular grid were averaged to give a representative value for the grid. In the creation of 100 m × 100 m grids, the Standard Grid Squares (Third Area Partitions) -Standard Grid Square and Grid Square Code Used for the Statistics (Announcement No. 143 by the Administrative Management Agency on July, 12, 1973) - were subdivided into squares with a side of 100 m.
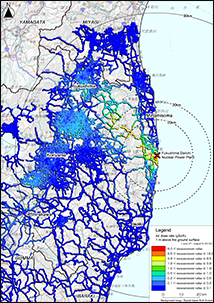
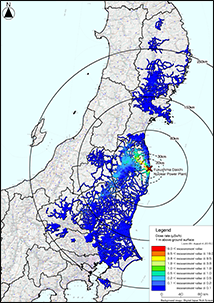
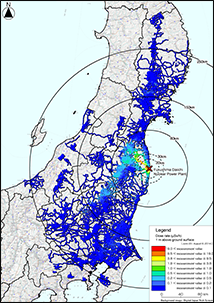
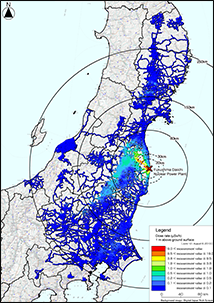
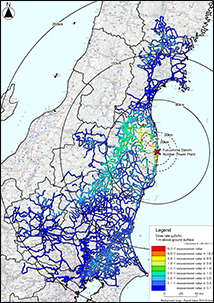
Air Dose Rate Measurement Results from the Twelfth Vehicle-borne Survey ( From June 27, to August 5, 2016 )
- This data was created based on the results of the vehicle-borne survey conducted by NRA from June 27, to August 5, 2016.
- The purposes of this vehicle survey were (1) to ascertain the tendency and cause of time change of air dose rates by comparing past vehicle survey data and survey meter data at the height of 1 m above ground as well as "walk survey" data, and (2) to contribute to the establishment of radioactive substances distribution prediction model.
- Based on the results of the analysis of nuclides in soil that MEXT had conducted so far, it is assumed that the air dose rates of the survey period are mostly due to radioactive cesium. MEXT evaluated the decrease in the air dose rates caused by the decay of cesium during the survey period and it was around 1%, which was smaller than the errors of measuring instruments. Therefore, NRA decided to use the measurement results as they are, without decay correction as of a certain date.
- Correction factor converting the measured air dose rate inside a car to the air dose rate outside is as follows.
- 1) When the measurement value is 1.0 μSv/h or more: correction coefficient = 1.3 (constant)
- 2) When the measurement value is between 0.01 and 1.0 μSv/h: correction coefficient = 0.06515 × ln (air dose rate inside the vehicle) + 1.3
- 3) When the measurement value is 0.01 μSv/h or less: correction coefficient = 1.0 (constant)
- KURAMA-II system with CsI(Tl) scintillation detectors were used.
- Measured values are the average of the values during the 1.5 seconds required for GPS to read location information.
- In this survey, in order to reduce the statistical variation of the measurement value, the areas where the vehicle was driven were separated into 100 m × 100 m grids, and the air dose rate values of the measurement points that were included in a particular grid were averaged to give a representative value for the grid. In the creation of 100 m × 100 m grids, the Standard Grid Squares (Third Area Partitions) -Standard Grid Square and Grid Square Code Used for the Statistics (Announcement No. 143 by the Administrative Management Agency on July, 12, 1973) - were subdivided into squares with a side of 100 m.
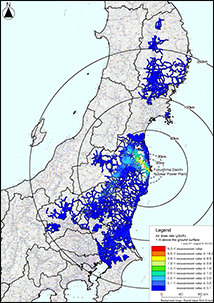
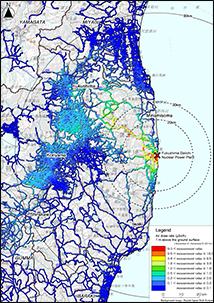
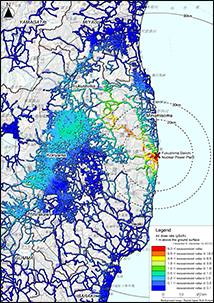
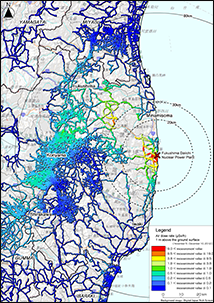
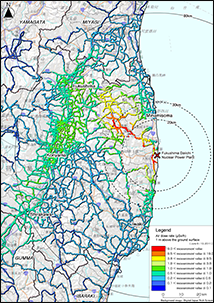
Air Dose Rate Measurement Results from the Eleventh Vehicle-borne Survey ( From November 2, to December 18, 2015 )
- This data was created based on the results of the vehicle-borne survey conducted by NRA from November 2, to December 18, 2015.
- The purposes of this vehicle survey were (1) to ascertain the tendency and cause of time change of air dose rates by comparing past vehicle survey data and survey meter data at the height of 1 m above ground as well as "walk survey" data, and (2) to contribute to the establishment of radioactive substances distribution prediction model.
- Based on the results of the analysis of nuclides in soil that MEXT had conducted so far, it is assumed that the air dose rates of the survey period are mostly due to radioactive cesium. MEXT evaluated the decrease in the air dose rates caused by the decay of cesium during the survey period and it was around 1%, which was smaller than the errors of measuring instruments. Therefore, NRA decided to use the measurement results as they are, without decay correction as of a certain date.
- Correction factor converting the measured air dose rate inside a car to the air dose rate outside is as follows.
- 1) When the measurement value is 1.0 μSv/h or more: correction coefficient = 1.3 (constant)
- 2) When the measurement value is between 0.01 and 1.0 μSv/h: correction coefficient = 0.06515 × ln (air dose rate inside the vehicle) + 1.3
- 3) When the measurement value is 0.01 μSv/h or less: correction coefficient = 1.0 (constant)
- KURAMA-II system with CsI(Tl) scintillation detectors were used.
- Measured values are the average of the values during the 1.5 seconds required for GPS to read location information.
- In this survey, in order to reduce the statistical variation of the measurement value, the areas where the vehicle was driven were separated into 100 m × 100 m grids, and the air dose rate values of the measurement points that were included in a particular grid were averaged to give a representative value for the grid. In the creation of 100 m × 100 m grids, the Standard Grid Squares (Third Area Partitions) -Standard Grid Square and Grid Square Code Used for the Statistics (Announcement No. 143 by the Administrative Management Agency on July, 12, 1973) - were subdivided into squares with a side of 100 m.
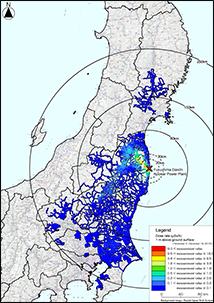
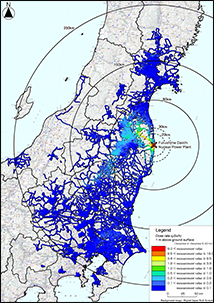
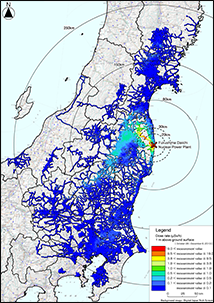
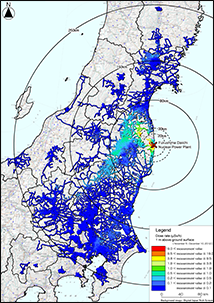
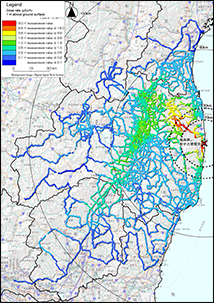
Air Dose Rate Measurement Results from the Tenth Vehicle-borne Survey ( From June 29, to August 4, 2015 )
- This data was created based on the results of the vehicle-borne survey conducted by NRA from June 29, to August 4, 2015.
- The purposes of this vehicle survey were (1) to ascertain the tendency and cause of time change of air dose rates by comparing past vehicle survey data and survey meter data at the height of 1 m above ground as well as "walk survey" data, and (2) to contribute to the establishment of radioactive substances distribution prediction model.
- Based on the results of the analysis of nuclides in soil that MEXT had conducted so far, it is assumed that the air dose rates of the survey period are mostly due to radioactive cesium. MEXT evaluated the decrease in the air dose rates caused by the decay of cesium during the survey period and it was around 1%, which was smaller than the errors of measuring instruments. Therefore, NRA decided to use the measurement results as they are, without decay correction as of a certain date.
- Correction factor converting the measured air dose rate inside a car to the air dose rate outside is as follows.
- 1) When the measurement value is 1.0 μSv/h or more: correction coefficient = 1.3 (constant)
- 2) When the measurement value is between 0.01 and 1.0 μSv/h: correction coefficient = 0.06515 × ln (air dose rate inside the vehicle) + 1.3
- 3) When the measurement value is 0.01 μSv/h or less: correction coefficient = 1.0 (constant)
- KURAMA-II system with CsI(Tl) scintillation detectors were used.
- Measured values are the average of the values during the 1.5 seconds required for GPS to read location information.
- In this survey, in order to reduce the statistical variation of the measurement value, the areas where the vehicle was driven were separated into 100 m × 100 m grids, and the air dose rate values of the measurement points that were included in a particular grid were averaged to give a representative value for the grid. In the creation of 100 m × 100 m grids, the Standard Grid Squares (Third Area Partitions) -Standard Grid Square and Grid Square Code Used for the Statistics (Announcement No. 143 by the Administrative Management Agency on July, 12, 1973) - were subdivided into squares with a side of 100 m.
Air Dose Rate Measurement Results from the Ninth Vehicle-borne Survey ( From November 4, to December 5, 2014 )
- This data was created based on the results of the vehicle-borne survey conducted by NRA from November 4, to December 5, 2014.
- The purposes of this vehicle survey were (1) to ascertain the tendency and cause of time change of air dose rates by comparing past vehicle survey data and survey meter data at the height of 1 m above ground as well as "walk survey" data, and (2) to contribute to the establishment of radioactive substances distribution prediction model.
- Based on the results of the analysis of nuclides in soil that MEXT had conducted so far, it is assumed that the air dose rates of the survey period are mostly due to radioactive cesium. MEXT evaluated the decrease in the air dose rates caused by the decay of cesium during the survey period and it was around 1%, which was smaller than the errors of measuring instruments. Therefore, NRA decided to use the measurement results as they are, without decay correction as of a certain date.
- Correction factor converting the measured air dose rate inside a car to the air dose rate outside is as follows.
- 1) When the measurement value is 1.0 μSv/h or more: correction coefficient = 1.3 (constant)
- 2) When the measurement value is between 0.01 and 1.0 μSv/h: correction coefficient = 0.06515 × ln (air dose rate inside the vehicle) + 1.3
- 3) When the measurement value is 0.01 μSv/h or less: correction coefficient = 1.0 (constant)
- KURAMA-II system with CsI(Tl) scintillation detectors were used.
- Measured values are the average of the values during the 1.5 seconds required for GPS to read location information.
- In this survey, in order to reduce the statistical variation of the measurement value, the areas where the vehicle was driven were separated into 100 m × 100 m grids, and the air dose rate values of the measurement points that were included in a particular grid were averaged to give a representative value for the grid. In the creation of 100 m × 100 m grids, the Standard Grid Squares (Third Area Partitions) -Standard Grid Square and Grid Square Code Used for the Statistics (Announcement No. 143 by the Administrative Management Agency on July, 12, 1973) - were subdivided into squares with a side of 100 m.
Air Dose Rate Measurement Results from the Eighth Vehicle-borne Survey ( From June 23, to August 8, 2014 )
- This data was created based on the results of the vehicle-borne survey conducted by NRA from June 23, to August 8, 2014.
- The purposes of this vehicle survey were (1) to ascertain the tendency and cause of time change of air dose rates by comparing past vehicle survey data and survey meter data at the height of 1 m above ground as well as "walk survey" data, and (2) to contribute to the establishment of radioactive substances distribution prediction model.
- Based on the results of the analysis of nuclides in soil that MEXT had conducted so far, it is assumed that the air dose rates of the survey period are mostly due to radioactive cesium. MEXT evaluated the decrease in the air dose rates caused by the decay of cesium during the survey period and it was around 1%, which was smaller than the errors of measuring instruments. Therefore, NRA decided to use the measurement results as they are, without decay correction as of a certain date.
- Correction factor converting the measured air dose rate inside a car to the air dose rate outside is as follows.
- 1) When the measurement value is 1.0 μSv/h or more: correction coefficient = 1.3 (constant)
- 2) When the measurement value is between 0.01 and 1.0 μSv/h: correction coefficient = 0.06515 × ln (air dose rate inside the vehicle) + 1.3
- 3) When the measurement value is 0.01 μSv/h or less: correction coefficient = 1.0 (constant)
- KURAMA-II system with CsI(Tl) scintillation detectors were used.
- Measured values are the average of the values during the 1.5 seconds required for GPS to read location information.
- In this survey, in order to reduce the statistical variation of the measurement value, the areas where the vehicle was driven were separated into 100 m × 100 m grids, and the air dose rate values of the measurement points that were included in a particular grid were averaged to give a representative value for the grid. In the creation of 100 m × 100 m grids, the Standard Grid Squares (Third Area Partitions) -Standard Grid Square and Grid Square Code Used for the Statistics (Announcement No. 143 by the Administrative Management Agency on July, 12, 1973) - were subdivided into squares with a side of 100 m.
Air Dose Rate Measurement Results from the Seventh Vehicle-borne Survey ( From November 5, to December 12, 2013 )
- This data was created based on the results of the vehicle-borne survey conducted by NRA from November 5, to December 12, 2013.
- The purposes of this vehicle survey were (1) to ascertain the tendency and cause of time change of air dose rates by comparing past vehicle survey data and survey meter data at the height of 1 m above ground as well as "walk survey" data, and (2) to contribute to the establishment of radioactive substances distribution prediction model.
- Based on the results of the analysis of nuclides in soil that MEXT had conducted so far, it is assumed that the air dose rates of the survey period are mostly due to radioactive cesium. MEXT evaluated the decrease in the air dose rates caused by the decay of cesium during the survey period and it was around 1%, which was smaller than the errors of measuring instruments. Therefore, NRA decided to use the measurement results as they are, without decay correction as of a certain date.
- Correction factor converting the measured air dose rate inside a car to the air dose rate outside is as follows.
- 1) When the measurement value is 1.0 μSv/h or more: correction coefficient = 1.3 (constant)
- 2) When the measurement value is between 0.01 and 1.0 μSv/h: correction coefficient = 0.06515 × ln (air dose rate inside the vehicle) + 1.3
- 3) When the measurement value is 0.01 μSv/h or less: correction coefficient = 1.0 (constant)
- KURAMA-II system with CsI(Tl) scintillation detectors were used.
- Measured values are the average of the values during the 1.5 seconds required for GPS to read location information.
- In this survey, in order to reduce the statistical variation of the measurement value, the areas where the vehicle was driven were separated into 100 m × 100 m grids, and the air dose rate values of the measurement points that were included in a particular grid were averaged to give a representative value for the grid. In the creation of 100 m × 100 m grids, the Standard Grid Squares (Third Area Partitions) -Standard Grid Square and Grid Square Code Used for the Statistics (Announcement No. 143 by the Administrative Management Agency on July, 12, 1973) - were subdivided into squares with a side of 100 m.
Air Dose Rate Measurement Results from the Sixth Vehicle-borne Survey ( From June 12, to August 8, 2013 )
- This data was created based on the results of the vehicle-borne survey conducted by NRA from June 12, to August 8, 2013.
- The purposes of this vehicle survey were (1) to ascertain the tendency and cause of time change of air dose rates by comparing past vehicle survey data and survey meter data at the height of 1 m above ground as well as "walk survey" data, and (2) to contribute to the establishment of radioactive substances distribution prediction model.
- Based on the results of the analysis of nuclides in soil that MEXT had conducted so far, it is assumed that the air dose rates of the survey period are mostly due to radioactive cesium. MEXT evaluated the decrease in the air dose rates caused by the decay of cesium during the survey period and it was around 1%, which was smaller than the errors of measuring instruments. Therefore, NRA decided to use the measurement results as they are, without decay correction as of a certain date.
- Correction factor converting the measured air dose rate inside a car to the air dose rate outside is as follows.
- 1) When the measurement value is 1.0 μSv/h or more: correction coefficient = 1.3 (constant)
- 2) When the measurement value is between 0.01 and 1.0 μSv/h: correction coefficient = 0.06515 × ln (air dose rate inside the vehicle) + 1.3
- 3) When the measurement value is 0.01 μSv/h or less: correction coefficient = 1.0 (constant)
- KURAMA-II system with CsI(Tl) scintillation detectors were used.
- Measured values are the average of the values during the 1.5 seconds required for GPS to read location information.
- In this survey, in order to reduce the statistical variation of the measurement value, the areas where the vehicle was driven were separated into 100 m × 100 m grids, and the air dose rate values of the measurement points that were included in a particular grid were averaged to give a representative value for the grid. In the creation of 100 m × 100 m grids, the Standard Grid Squares (Third Area Partitions) -Standard Grid Square and Grid Square Code Used for the Statistics (Announcement No. 143 by the Administrative Management Agency on July, 12, 1973) - were subdivided into squares with a side of 100 m.
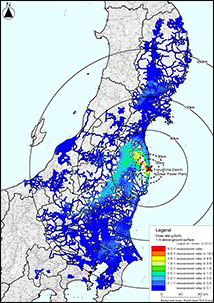
Air Dose Rate Measurement Results from the Fifth Vehicle-borne Survey ( From November 5, 2012 to December 10, 2012 )
- This data was created based on the results of the vehicle-borne survey conducted by MEXT from November 5 to December 10, 2012.
- A vehicle-borne survey was conducted for two purposes; one was to ascertain air dose rate distribution on roads that was subjected to the accumulation of radioactive substances around roads, another was to confirm changes of air dose rate due to typhoon that might affect the radioactive substances movement in significant amount.
- Based on the results of the analysis of nuclides in soil that MEXT had conducted so far, it is considered that the survey period air dose rates are mostly due to radioactive cesium. MEXT evaluated the decrease in the air dose rates caused by the decay of cesium during the survey period and it was around 2%, which was smaller than the errors of measuring instruments. Therefore, MEXT decided to use the measurement results as they are, without decay correction as of a certain date.
- Correction factor converting the measured air dose rate inside a car to the air dose rate outside is as follows.
- 1) When the measurement value is 1.0 µSv/h or more: correction coefficient = 1.3 (constant)
- 2) When the measurement value is between 0.01 and 1.0 µSv/h: correction coefficient = 0.06515 × ln (air dose rate inside the vehicle) + 1.3
- 3) When the measurement value is 0.01 µSv/h or less: correction coefficient = 1.0 (constant)
- * Different correction was conducted if measurement condition differed.
- KURAMA-II system with CsI scintillation detectors were used.
- Measured values are the average of the values during the 1.5 seconds required for GPS to read location information.
- In this survey, in order to reduce the statistical variation of the measurement value, the areas where the vehicle was driven were separated into 100 m × 100 m grids, and the air dose rate values of the measurement points that were included in a particular grid were averaged to give a representative value for the grid. In the creation of 100 m × 100 m grids, the Standard Grid Squares (Third Area Partitions) -Standard Grid Square and Grid Square Code Used for the Statistics (Announcement No. 143 by the Administrative Management Agency on July, 12, 1973) - were subdivided into squares with a side of 100 m.
Air Dose Rate Measurement Results from the Fourth Vehicle-borne Survey ( From August 20, 2012 to October 12, 2012 )
- This data was created based on the results of the vehicle-borne survey conducted by MEXT from August 20 to October 12, 2012.
- A vehicle-borne survey was conducted for two purposes; one was to ascertain air dose rate distribution on roads that was subjected to the accumulation of radioactive substances around roads, another was to confirm changes of air dose rate due to typhoon that might affect the radioactive substances movement in significant amount.
- Based on the results of the analysis of nuclides in soil that MEXT had conducted so far, it is considered that the survey period air dose rates are mostly due to radioactive cesium. MEXT evaluated the decrease in the air dose rates caused by the decay of cesium during the survey period and it was around 2%, which was smaller than the errors of measuring instruments. Therefore, MEXT decided to use the measurement results as they are, without decay correction as of a certain date.
- Correction factor converting the measured air dose rate inside a car to the air dose rate outside is as follows.
- 1) When the measurement value is 1.0 µSv/h or more: correction coefficient = 1.3 (constant)
- 2) When the measurement value is between 0.01 and 1.0 µSv/h: correction coefficient = 0.06515 × ln (air dose rate inside the vehicle) + 1.3
- 3) When the measurement value is 0.01 µSv/h or less: correction coefficient = 1.0 (constant)
- * Different correction was conducted if measurement condition differed.
- KURAMA-II system with CsI scintillation detectors were used.
- Measured values are the average of the values during the 1.5 seconds required for GPS to read location information.
- In this survey, in order to reduce the statistical variation of the measurement value, the areas where the vehicle was driven were separated into 100 m × 100 m grids, and the air dose rate values of the measurement points that were included in a particular grid were averaged to give a representative value for the grid. In the creation of 100 m × 100 m grids, the Standard Grid Squares (Third Area Partitions) -Standard Grid Square and Grid Square Code Used for the Statistics (Announcement No. 143 by the Administrative Management Agency on July, 12, 1973) - were subdivided into squares with a side of 100 m.
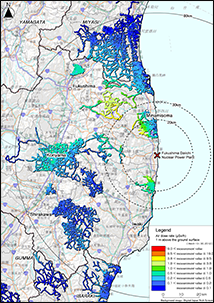
Air Dose Rate Measurement Results from the Third Vehicle-borne Survey ( From March 13, 2012 to March 30, 2012 )
- This data was created based on the results of the vehicle-borne survey conducted by MEXT from March 13 to March 30, 2012.
- Based on the results of the analysis of nuclides in soil that MEXT had conducted so far, it is considered that the survey period air dose rates are mostly due to radioactive cesium. MEXT evaluated the decrease in the air dose rates caused by the decay of cesium during the survey period and it was around 2%, which was smaller than the errors of measuring instruments. Therefore, MEXT decided to use the measurement results as they are, without decay correction as of a certain date.
- Correction coefficients are as follows (See "Results of Continuous Measurement of Air Dose Rates Through a Vehicle-borne Survey (as of March 2012)" (Sep 12, 2011) Attachment 2 for details)
- 1) When the measurement value is 1.0 µSv/h or more: correction coefficient = 1.3 (constant)
- 2) When the measurement value is between 0.01 and 1.0 µSv/h: correction coefficient = 0.06515 × ln (air dose rate inside the vehicle) + 1.3
- 3) When the measurement value is 0.01 µSv/h or less: correction coefficient = 1.0 (constant)
- KURAMA-II system with CsI scintillation detectors were used.
- Measured values are the average of the values during the 1.5 seconds required for GPS to read location information.
- In the third vehicle-borne survey, in order to reduce the statistical variation of the measurement value, the areas where the vehicle was driven were separated into 100 m × 100 m grids, and the air dose rate values of the measurement points that were included in a particular grid were averaged to give a representative value for the grid. In the creation of 100 m × 100 m grids, the Standard Grid Squares (Third Area Partitions) -Standard Grid Square and Grid Square Code Used for the Statistics (Announcement No. 143 by the Administrative Management Agency on July, 12, 1973) - were subdivided into squares with a side of 100 m.
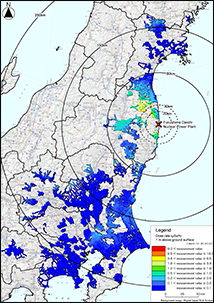
Air Dose Rate Measurement Results from the Second Vehicle-borne Survey ( From December 5, 2011 to December 28, 2011 )
- This data was created based on the results of the vehicle-borne survey conducted by MEXT from December 5 to December 28, 2011.
- We drove a total of about 39,000 km, and measured air dose rates at the height of 1 m above the ground surface around these roads.
- Based on the results of the analysis of nuclides in soil that MEXT had conducted so far, it is considered that the survey period air dose rates are mostly due to radioactive cesium. MEXT evaluated the decrease in the air dose rates caused by the decay of cesium during the survey period and it was around 2%, which was smaller than the errors of measuring instruments. Therefore, MEXT decided to use the measurement results as they are, without decay correction as of a certain date.
- There was snow coverage in some part of the targeted areas of this monitoring. Past monitoring results by MEXT have shown that air dose rates are apt to be lower at points covered by snow, with gamma rays being shielded, and the same tendency is expected to be observed. Therefore, in order to distinguish areas covered by snow, we displayed snow coverage on the map. When identifying areas covered by snow, we used data obtained by NASA’s earth observation satellites, Terra and Aqua*2, which are available on the JASMES*1 released by the Japan Aerospace Exploration Agency.
- Correction coefficients are as follows (See "Results of Continuous Measurement of Air Dose Rates Through a Vehicle-borne Survey (as of March 2012)" (Sep 12, 2011) Attachment 2 for details)
- 1) When the measurement value is 1.0 µSv/h or more: correction coefficient = 1.3 (constant)
- 2) When the measurement value is between 0.01 and 1.0 µSv/h: correction coefficient = 0.06515 × ln (air dose rate inside the vehicle) + 1.3
- 3) When the measurement value is 0.01 µSv/h or less: correction coefficient = 1.0 (constant)
- Air dose rates were measured using calibrated NaI scintillation survey meters or ionization chamber type survey meters connected to the KURAMA system. In the KURAMA system, At points where air dose rates did not exceed 30 µSv per hour, NaI scintillation survey meters were used, and at points where air dose rates exceeded 30 µSv per hour, ionization chamber type survey meters were used by switching the connection.
- Measured values are the average of the values during the 1.5 seconds required for GPS to read location information.
- In the second vehicle-borne survey, in order to reduce the statistical variation of the measurement value, the areas where the vehicle was driven were separated into 100 m × 100 m grids, and the air dose rate values of the measurement points that were included in a particular grid were averaged to give a representative value for the grid. In the creation of 100 m × 100 m grids, the Standard Grid Squares (Third Area Partitions) -Standard Grid Square and Grid Square Code Used for the Statistics (Announcement No. 143 by the Administrative Management Agency on July, 12, 1973) - were subdivided into squares with a side of 100 m.
*1:JAXA Satellite Monitoring for Environmental Studies
*2:We used the data of snow coverage around Japan, which were observed by the Moderate Resolution Imaging Spectroradiometer (MODIS) installed on NASA’s earth observation satellites, Terra and Aqua, and were analyzed by the Japan Aerospace Exploration Agency (JAXA) using its original processing algorithm. JAXA has been planning the Global Change Observation Mission (GCOM) to observe the Earth’s environment as a whole, including the atmosphere, ocean, land, snow and ice, from space on a long-term basis (10 to 15 years), thereby monitoring hydrologic circulation and climate change and figuring out the mechanisms thereof. Said data have been collected and processed for the purpose of assessing the analytical algorithm for optical sensors used in the Global Change Observation Satellite (GCOM-C). As they are 500 m-grid data, snow coverage over 5 cm with an even surface can be indicated correctly, but it is sometimes difficult to accurately identify snow coverage of a shallower depth or with an uneven surface.
Air Dose Rate Measurement Results from the First Vehicle-borne Survey ( From June 6, 2011 to June 13, 2011 )
- This data was created based on the results of the vehicle-borne survey conducted by MEXT from June 6 to June 13, 2011.
- We drove a total of about 17,000 km, and measured air dose rates at the height of 1 m above the ground surface around these roads.
- Based on the results of the analysis of nuclides in soil that MEXT had conducted so far, it is considered that the survey period air dose rates are mostly due to radioactive cesium. MEXT evaluated the decrease in the air dose rates caused by the decay of cesium during the survey period and it was around 2%, which was smaller than the errors of measuring instruments. Therefore, MEXT decided to use the measurement results as they are, without decay correction as of a certain date.
- Air dose rates were measured using calibrated NaI scintillation survey meters or ionization chamber type survey meters connected to the KURAMA system. In the KURAMA system, At points where air dose rates did not exceed 30 µSv per hour, NaI scintillation survey meters were used, and at points where air dose rates exceeded 30 µSv per hour, ionization chamber type survey meters were used by switching the connection.
- Measured values are the average of the values during the 1.5 seconds required for GPS to read location information.
- Air dose rates measured by each survey meter equipped inside a vehicle were corrected using a coefficient separately defined, considering shielding effects caused by the vehicle and differences in the height of measuring, and air dose rates measured in the vehicle were converted to air dose rates at the height of 1 m above the ground surface of each location. In order to examine the dependency on air dose rates of the coefficient, we derived correction coefficients at several locations showing low air dose rates to high air dose rates, all of which meet the requirements of being a vast place without any obstacles around. As a result, we decided to use the correction coefficient of 1.3 uniformly from low to high air does rates range. Although the correction coefficient of 1.3 overestimates air dose rate in the low air dose area, we use the correction coefficient of 1.3 in order to make a safe-side estimation.
Time Series Analysis ( 2011 - 2016 )
- This data was created based on the air dose rate results of the KURAMA-II vehicle survey from 2011 to 2016 (13 times).
- Time series data were created based on the third area partitions (100 m x 100 m grid). For the grids that had five or more data points, regression models were estimated using the least-squares method and attenuation rates were derived.
- The original data contain systematic errors due to measuring instruments, positioning errors by GPS, statistical errors due to number of sampling points. Uncertainties due to systematic error and statistical errors are as follows:
- The analysis range was set to be an 80 km radius from the TEPCO Fukushima Dai-ichi NPP, where many points of high accumulation of radioactive substances were confirmed.
- Uncertainty of each measurement value (average in 100 m x 100 m grid) is +- 10.4%.
Air Dose Rate Measurement Results from the Thirteenth Vehicle-borne Survey ( From October 31, to December 16, 2016 )
KML
XML
CSV
Air Dose Rate Measurement Results from the Twelfth Vehicle-borne Survey ( From June 27, to August 5, 2016 )
KML
XML
CSV
Air Dose Rate Measurement Results from the Eleventh Vehicle-borne Survey ( From November 2, to December 18, 2015 )
KML
XML
CSV
Air Dose Rate Measurement Results from the Tenth Vehicle-borne Survey ( From June 29, to August 4, 2015 )
KML
XML
CSV
Air Dose Rate Measurement Results from the Ninth Vehicle-borne Survey ( From November 4, to December 5, 2014 )
KML
XML
CSV
Air Dose Rate Measurement Results from the Eighth Vehicle-borne Survey ( From June 23, to August 8, 2014 )
KML
XML
CSV
Air Dose Rate Measurement Results from the Seventh Vehicle-borne Survey ( From November 5, to December 12, 2013 )
KML
XML
CSV
Air Dose Rate Measurement Results from the Sixth Vehicle-borne Survey ( From June 12, to August 8, 2013 )
KML
XML
CSV
Air Dose Rate Measurement Results from the Fifth Vehicle-borne Survey ( From November 5, 2012 to December 10, 2012 )
KML
XML
CSV
Air Dose Rate Measurement Results from the Fourth Vehicle-borne Survey ( From August 20, 2012 to October 12, 2012 )
KML
XML
CSV
Air Dose Rate Measurement Results from the Third Vehicle-borne Survey ( From March 13, 2012 to March 30, 2012 )
KML
XML
CSV
Air Dose Rate Measurement Results from the Second Vehicle-borne Survey ( From December 5, 2011 to December 28, 2011 )
KML
XML
CSV
Air Dose Rate Measurement Results from the First Vehicle-borne Survey ( From June 6, 2011 to June 13, 2011 )
KML
XML
CSV
Time Series Analysis ( 2011 - 2016 )
There is no content for 'Download File'
Air Dose Rate Measurement Results from the Thirteenth Vehicle-borne Survey ( From October 31, to December 16, 2016 )
Air Dose Rate Measurement Results from the Twelfth Vehicle-borne Survey ( From June 27, to August 5, 2016 )
Air Dose Rate Measurement Results from the Eleventh Vehicle-borne Survey ( From November 2, to December 18, 2015 )
Air Dose Rate Measurement Results from the Tenth Vehicle-borne Survey ( From June 29, to August 4, 2015 )
Air Dose Rate Measurement Results from the Ninth Vehicle-borne Survey ( From November 4, to December 5, 2014 )
Air Dose Rate Measurement Results from the Eighth Vehicle-borne Survey ( From June 23, to August 8, 2014 )
Air Dose Rate Measurement Results from the Seventh Vehicle-borne Survey ( From November 5, to December 12, 2013 )
Air Dose Rate Measurement Results from the Sixth Vehicle-borne Survey ( From June 12, to August 8, 2013 )
Air Dose Rate Measurement Results from the Fifth Vehicle-borne Survey ( From November 5, 2012 to December 10, 2012 )
Air Dose Rate Measurement Results from the Fourth Vehicle-borne Survey ( From August 20, 2012 to October 12, 2012 )
Air Dose Rate Measurement Results from the Third Vehicle-borne Survey ( From March 13, 2012 to March 30, 2012 )
Air Dose Rate Measurement Results from the Second Vehicle-borne Survey ( From December 5, 2011 to December 28, 2011 )
Air Dose Rate Measurement Results from the First Vehicle-borne Survey ( From June 6, 2011 to June 13, 2011 )
- FY2016 Nuclear Regulation Authority Commissioned Project Report "Summary of Distribution Data of Radioactive Substances Stemming from the Fukushima Daiichi Nuclear Power Plant Accident"
- FY2015 Nuclear Regulation Authority Commissioned Project Report "Summary of Distribution Data of Radioactive Substances Stemming from the Fukushima Daiichi Nuclear Power Plant Accident"
- The Report of the Nuclear Regulation Authority Commissioned Project in FY 2014 - The Collection of the Radioactive Substances Distribution Data, and the Development of a Migration Model Associated with Fukushima Daiichi Nuclear Power Plant Accident -
- FY 2013 Nuclear Regulation Authority Commissioned Project Report "Establishment of A Comprehensive Approach of Long Term Effects by Radioactive Substances Due to Fukushima Daiichi Nuclear Power Plant Accident"
- FY 2012 Commissioned Project - Radioactivity Measurement and Investigation "Establishment of A Comprehension Approach of Long Term Effects by Radioactive Substances Due to Fukushima Daiichi Nuclear Power Plant Accident" Report
- KURAMA Ⅱ
- The Second Survey on the Distribution Condition of Radioactive Substances by MEXT due to the Accident at TEPCO’s Fukushima Dai-ichi NPP, Report on the Preparation of Distribution Maps of Radiation Doses, etc. (Part 1)
- KURAMA, A GPS-aided mobile radiation monitoring system
- Preparation of Distribution Map of Radiation Doses, etc. (Air Dose Rate Map) by MEXT - Attachment 2